Article Library
MEMBER MENU


4XPEDITION Channel Trends – March 2021
I have been actively building the 4XPEDITION YouTube channel now since January 2020. I launched the channel back in 2013 but really hadn’t invested my heart and soul the way I do now until the beginning of last year. So, what does a real focus produce? Let’s take a look at the YouTube analytics reports and see how the channel has grown, what needed improvement, and the projections and goals for this year.
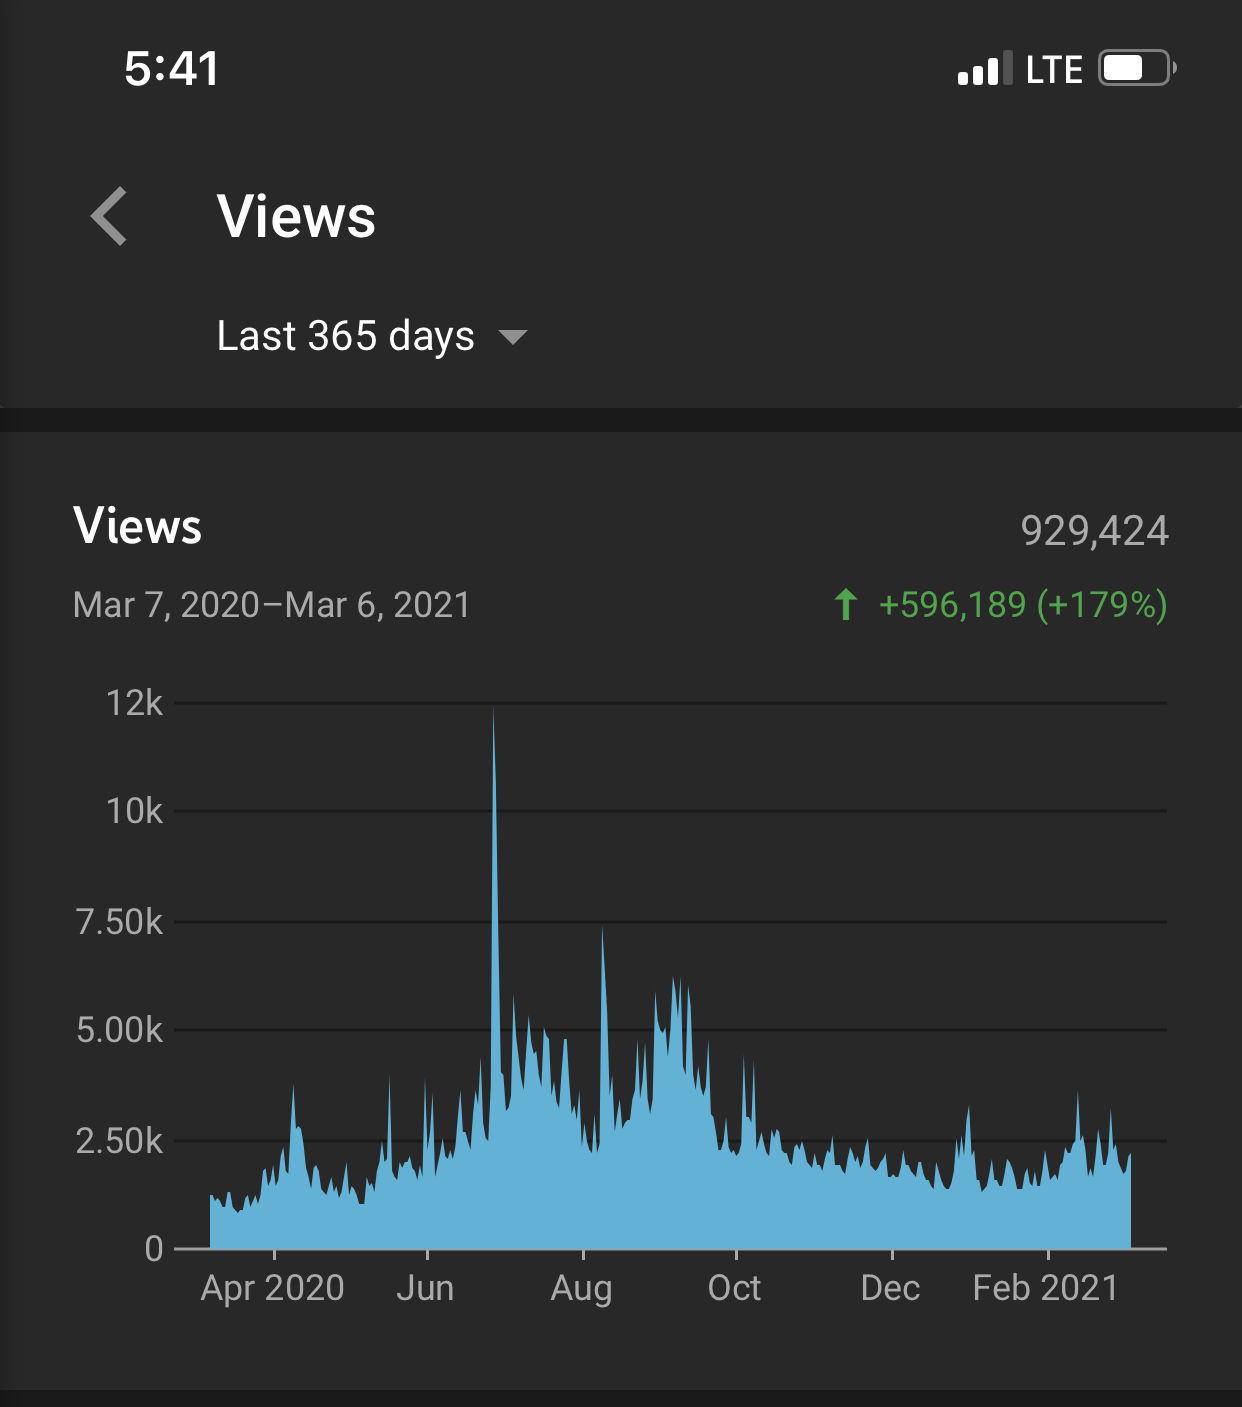
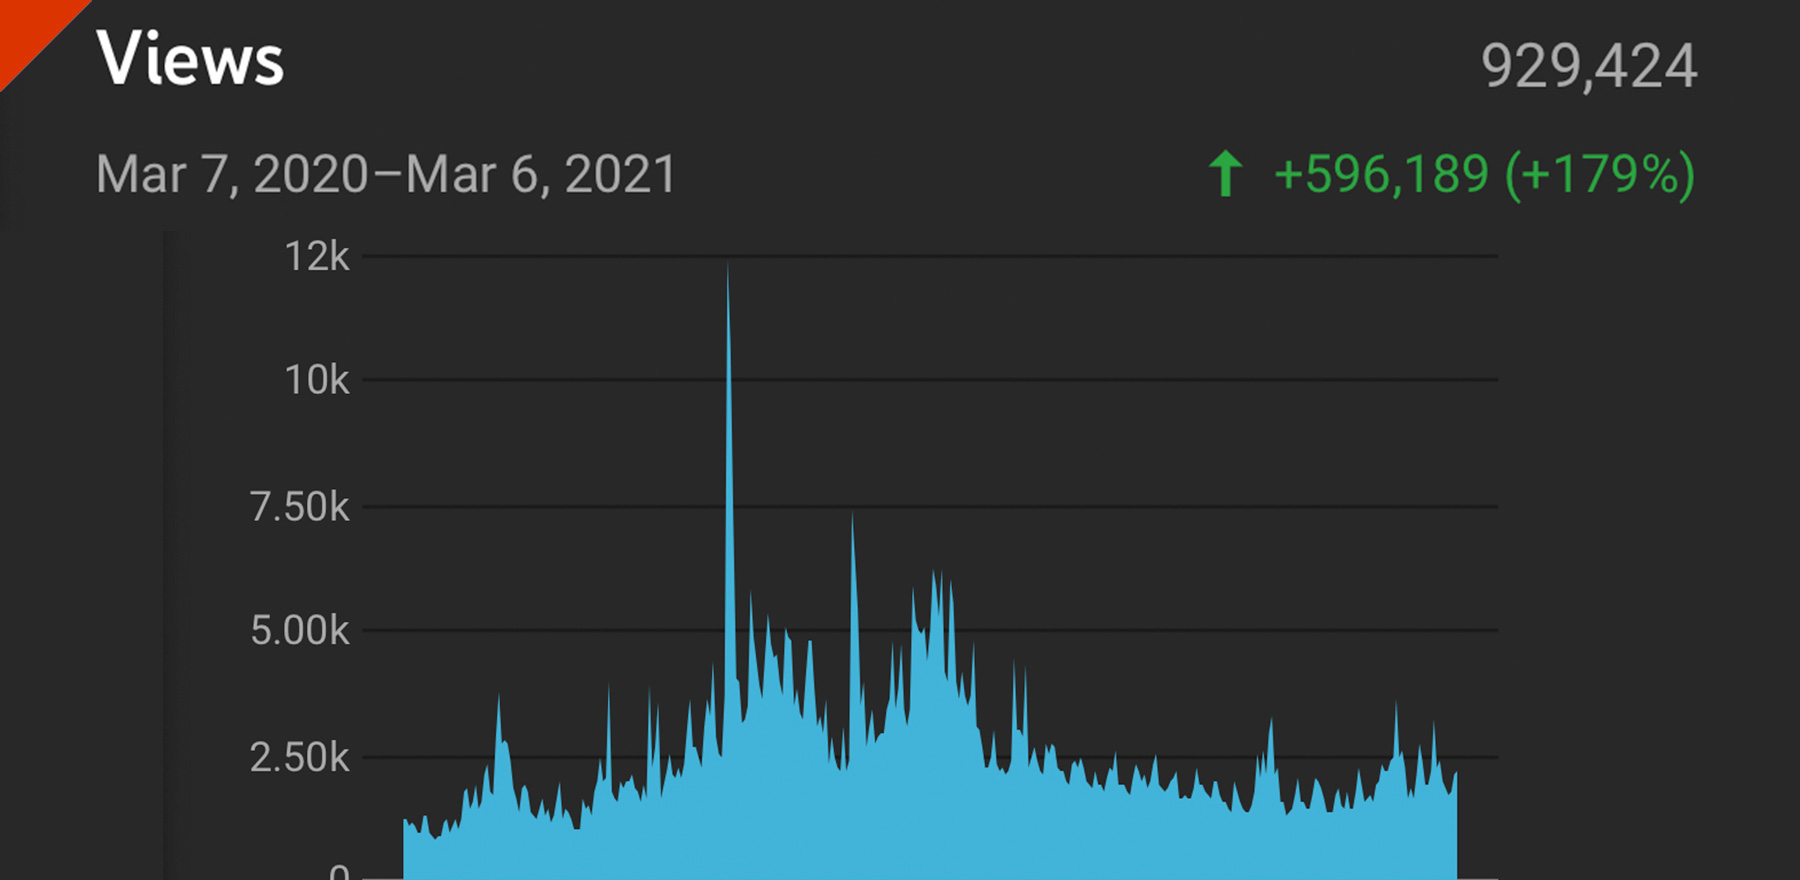
What this chart shows is the views over the last 365 days. You can see a huge spike on one day last summer. That’s because one of my videos, the Yellowstone video, hit the YouTube algorithm the way I would like all of them to do. That requires fast viewer growth early on. This is called ‘trending’. You can see I had about a million views over the last year overall.
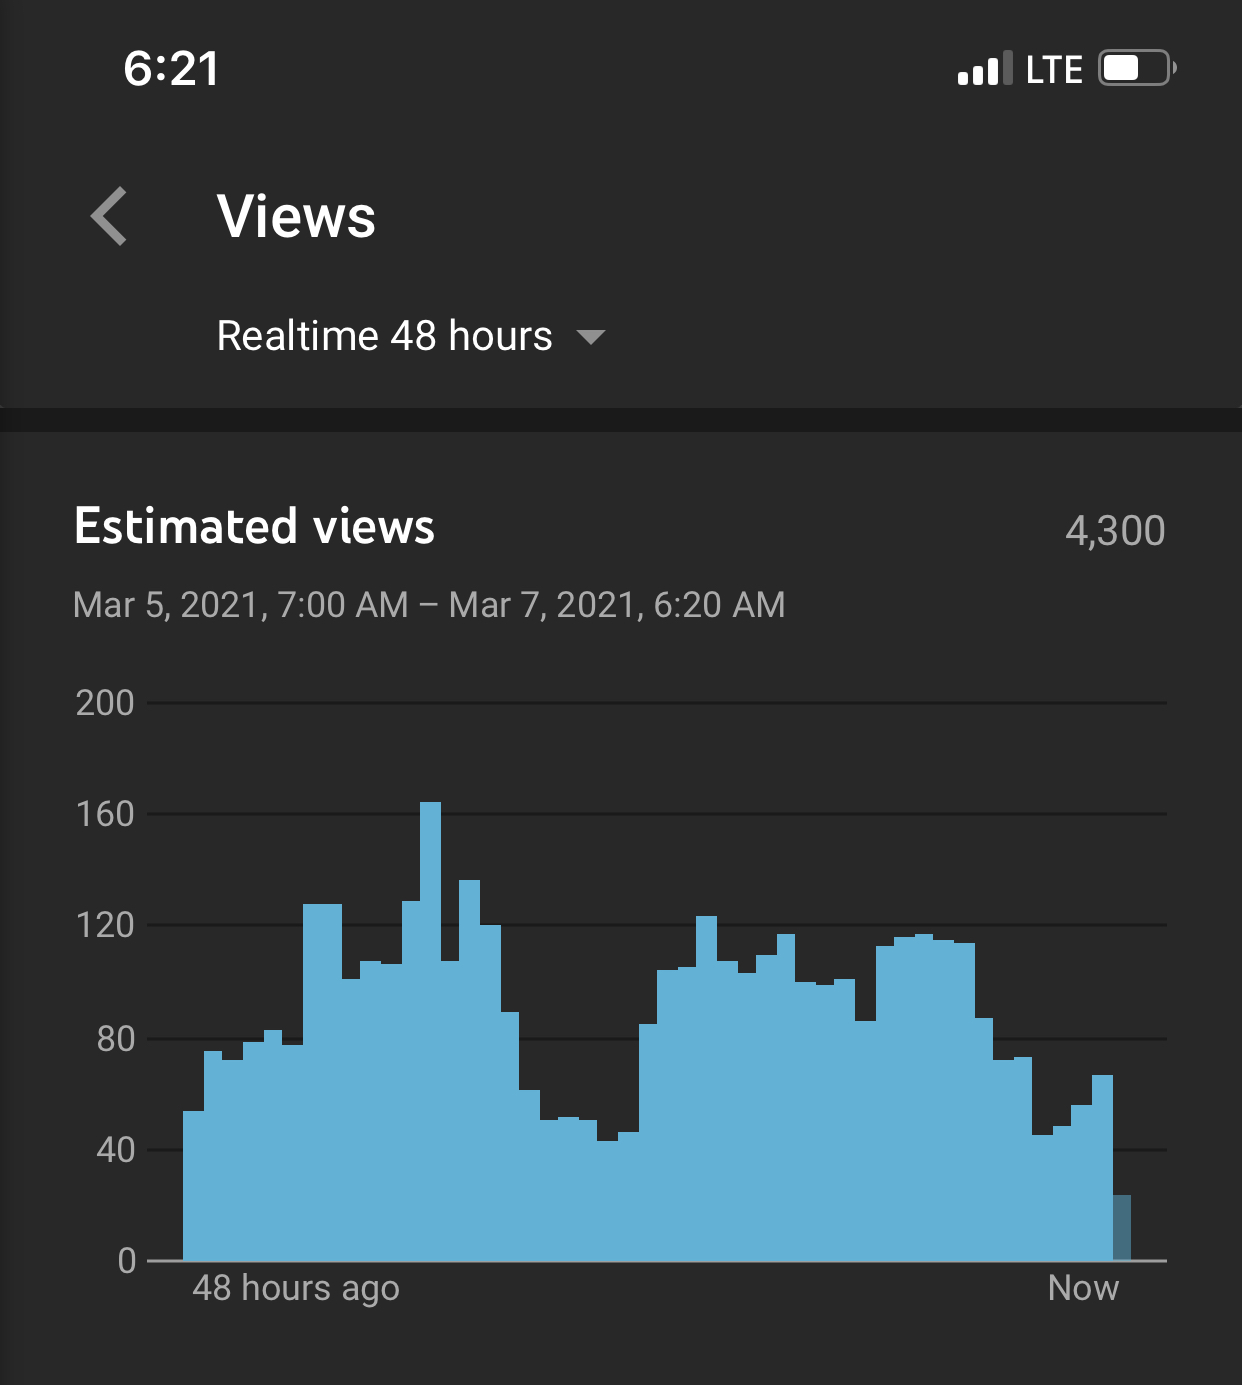
The chart above shows how many views the channel is getting in realtime (on March 7, 2021) This can give a prediction as to the future trajectory of the channel especially compared to this month last year and the upward trend last spring and summer demonstrates later in this article.
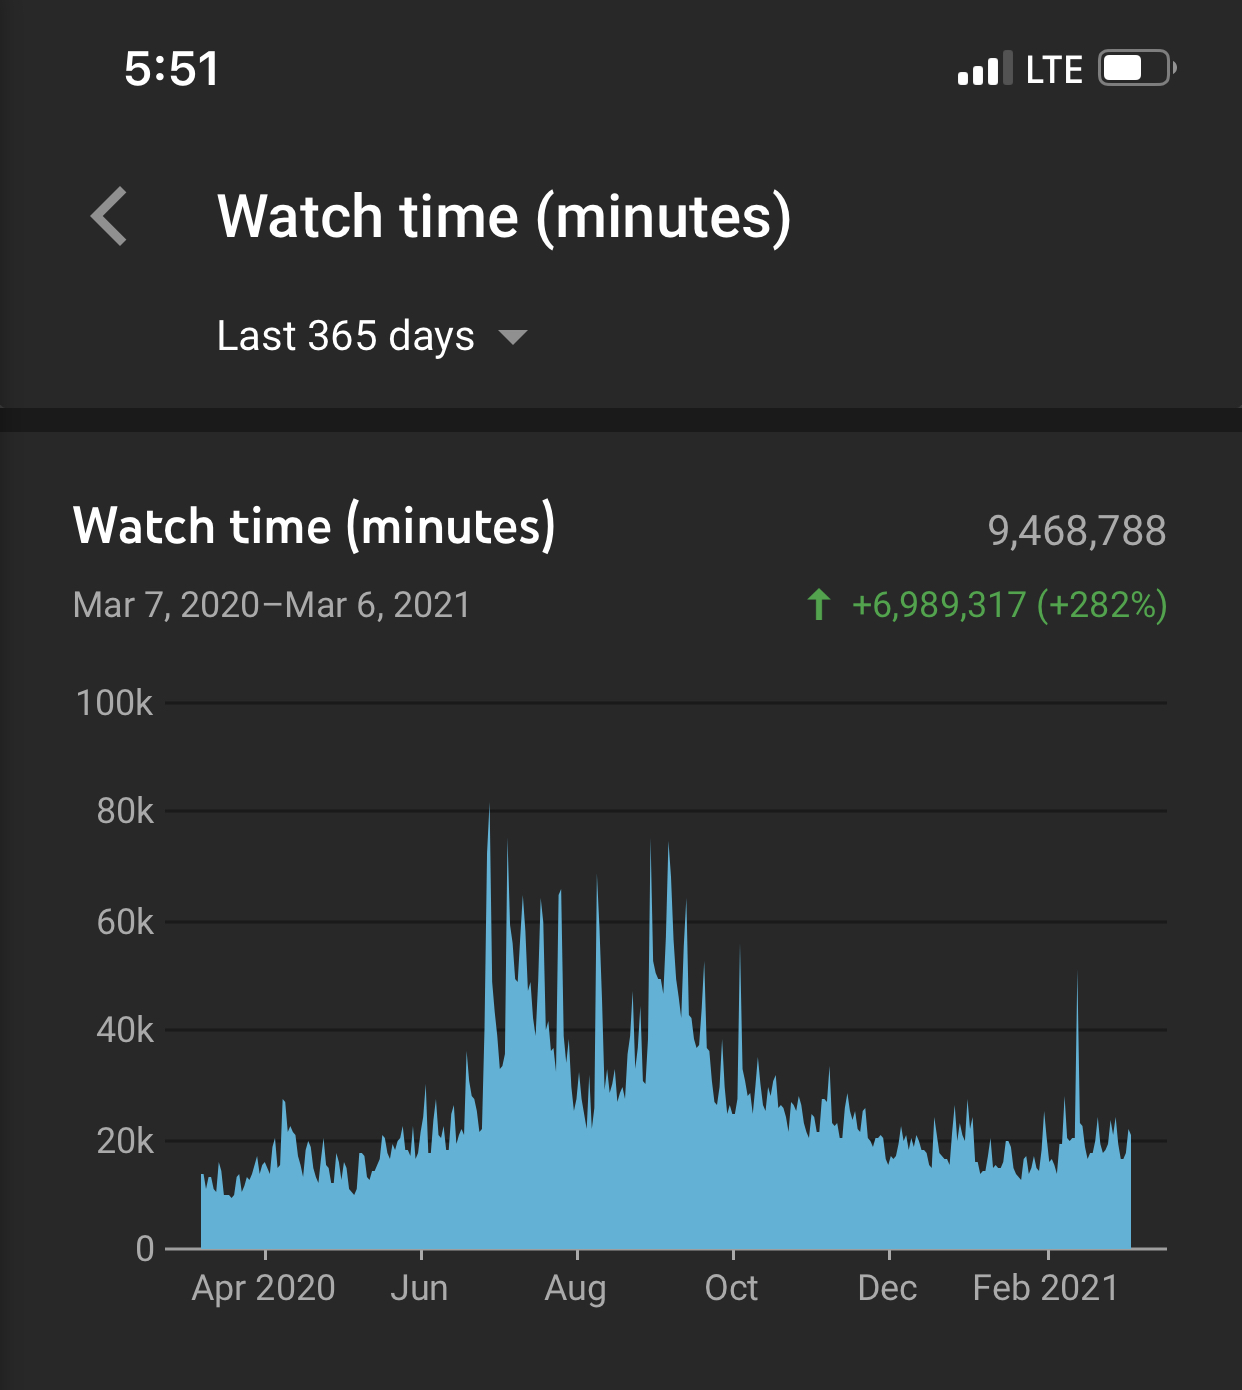
This chart shows how many minutes people watched my channel over the last 365 days. My goal this year is to beat those summer months time spent on my channel and to also keep all months leading up to summer above that of the months last year leading up to summer. Also, last fall I had ankle surgery and that caused the winter numbers to dip down pretty low. My goal overall is to stay above last year all together. Note also that many people watch for many different reasons. So, for instance, the Boundary Waters Canoe video does really well in winter time when people from Minnesota are socked in with snow and are longing for canoeing in BWCA. This causes search to increase in winter for that subject. So, even though that video is now 3 years old, it still performs well seasonally.
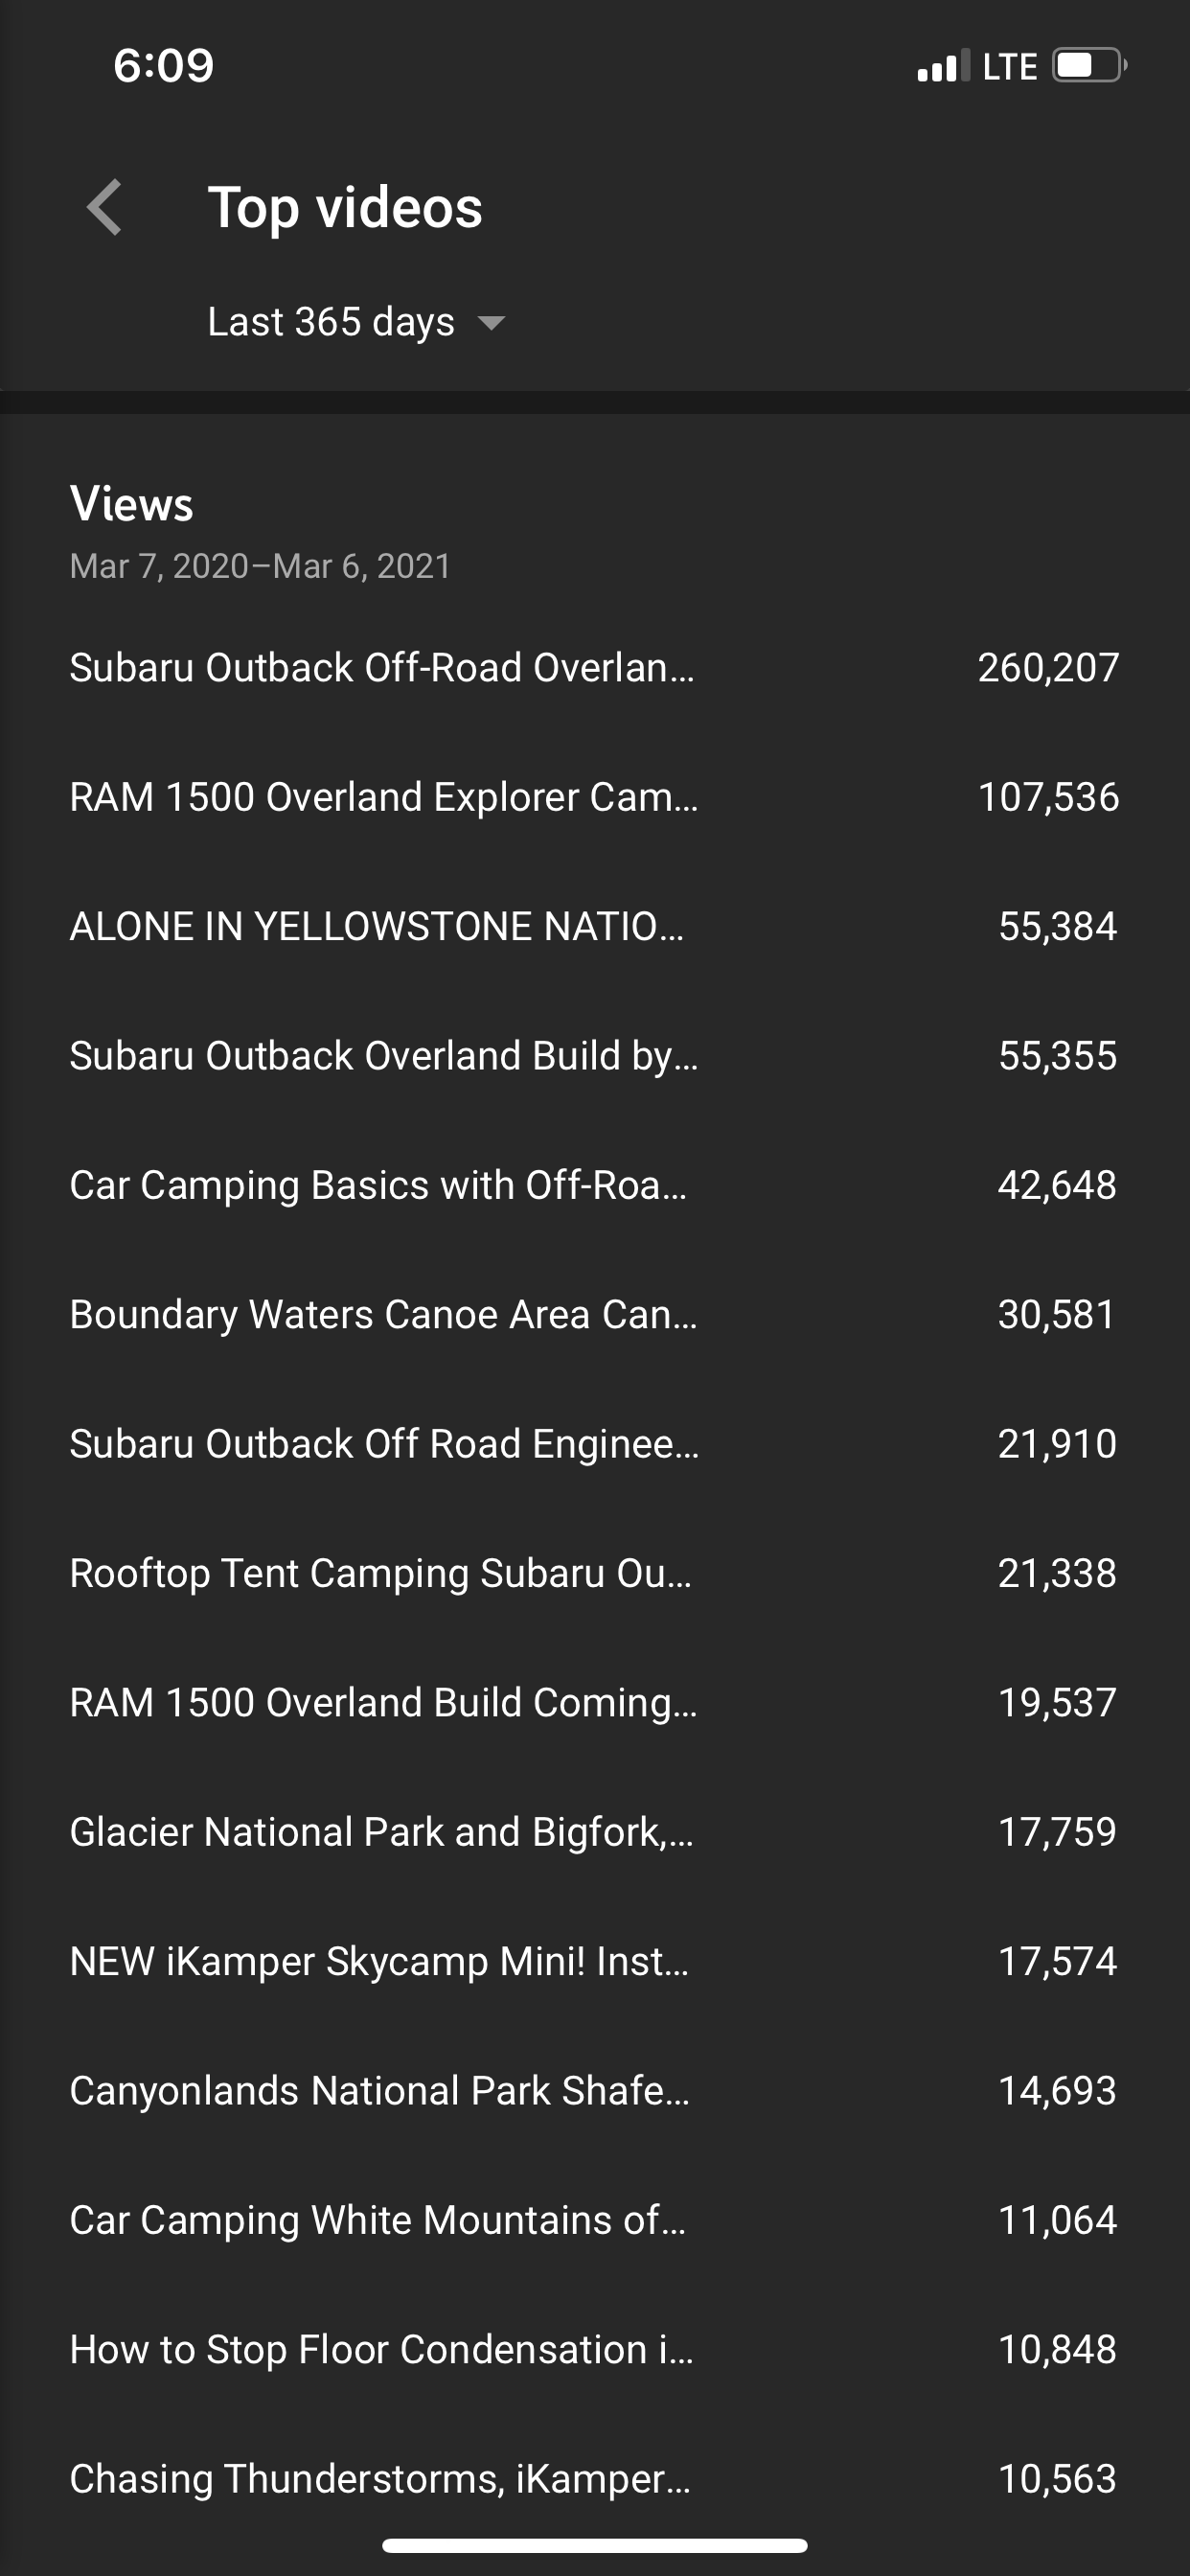
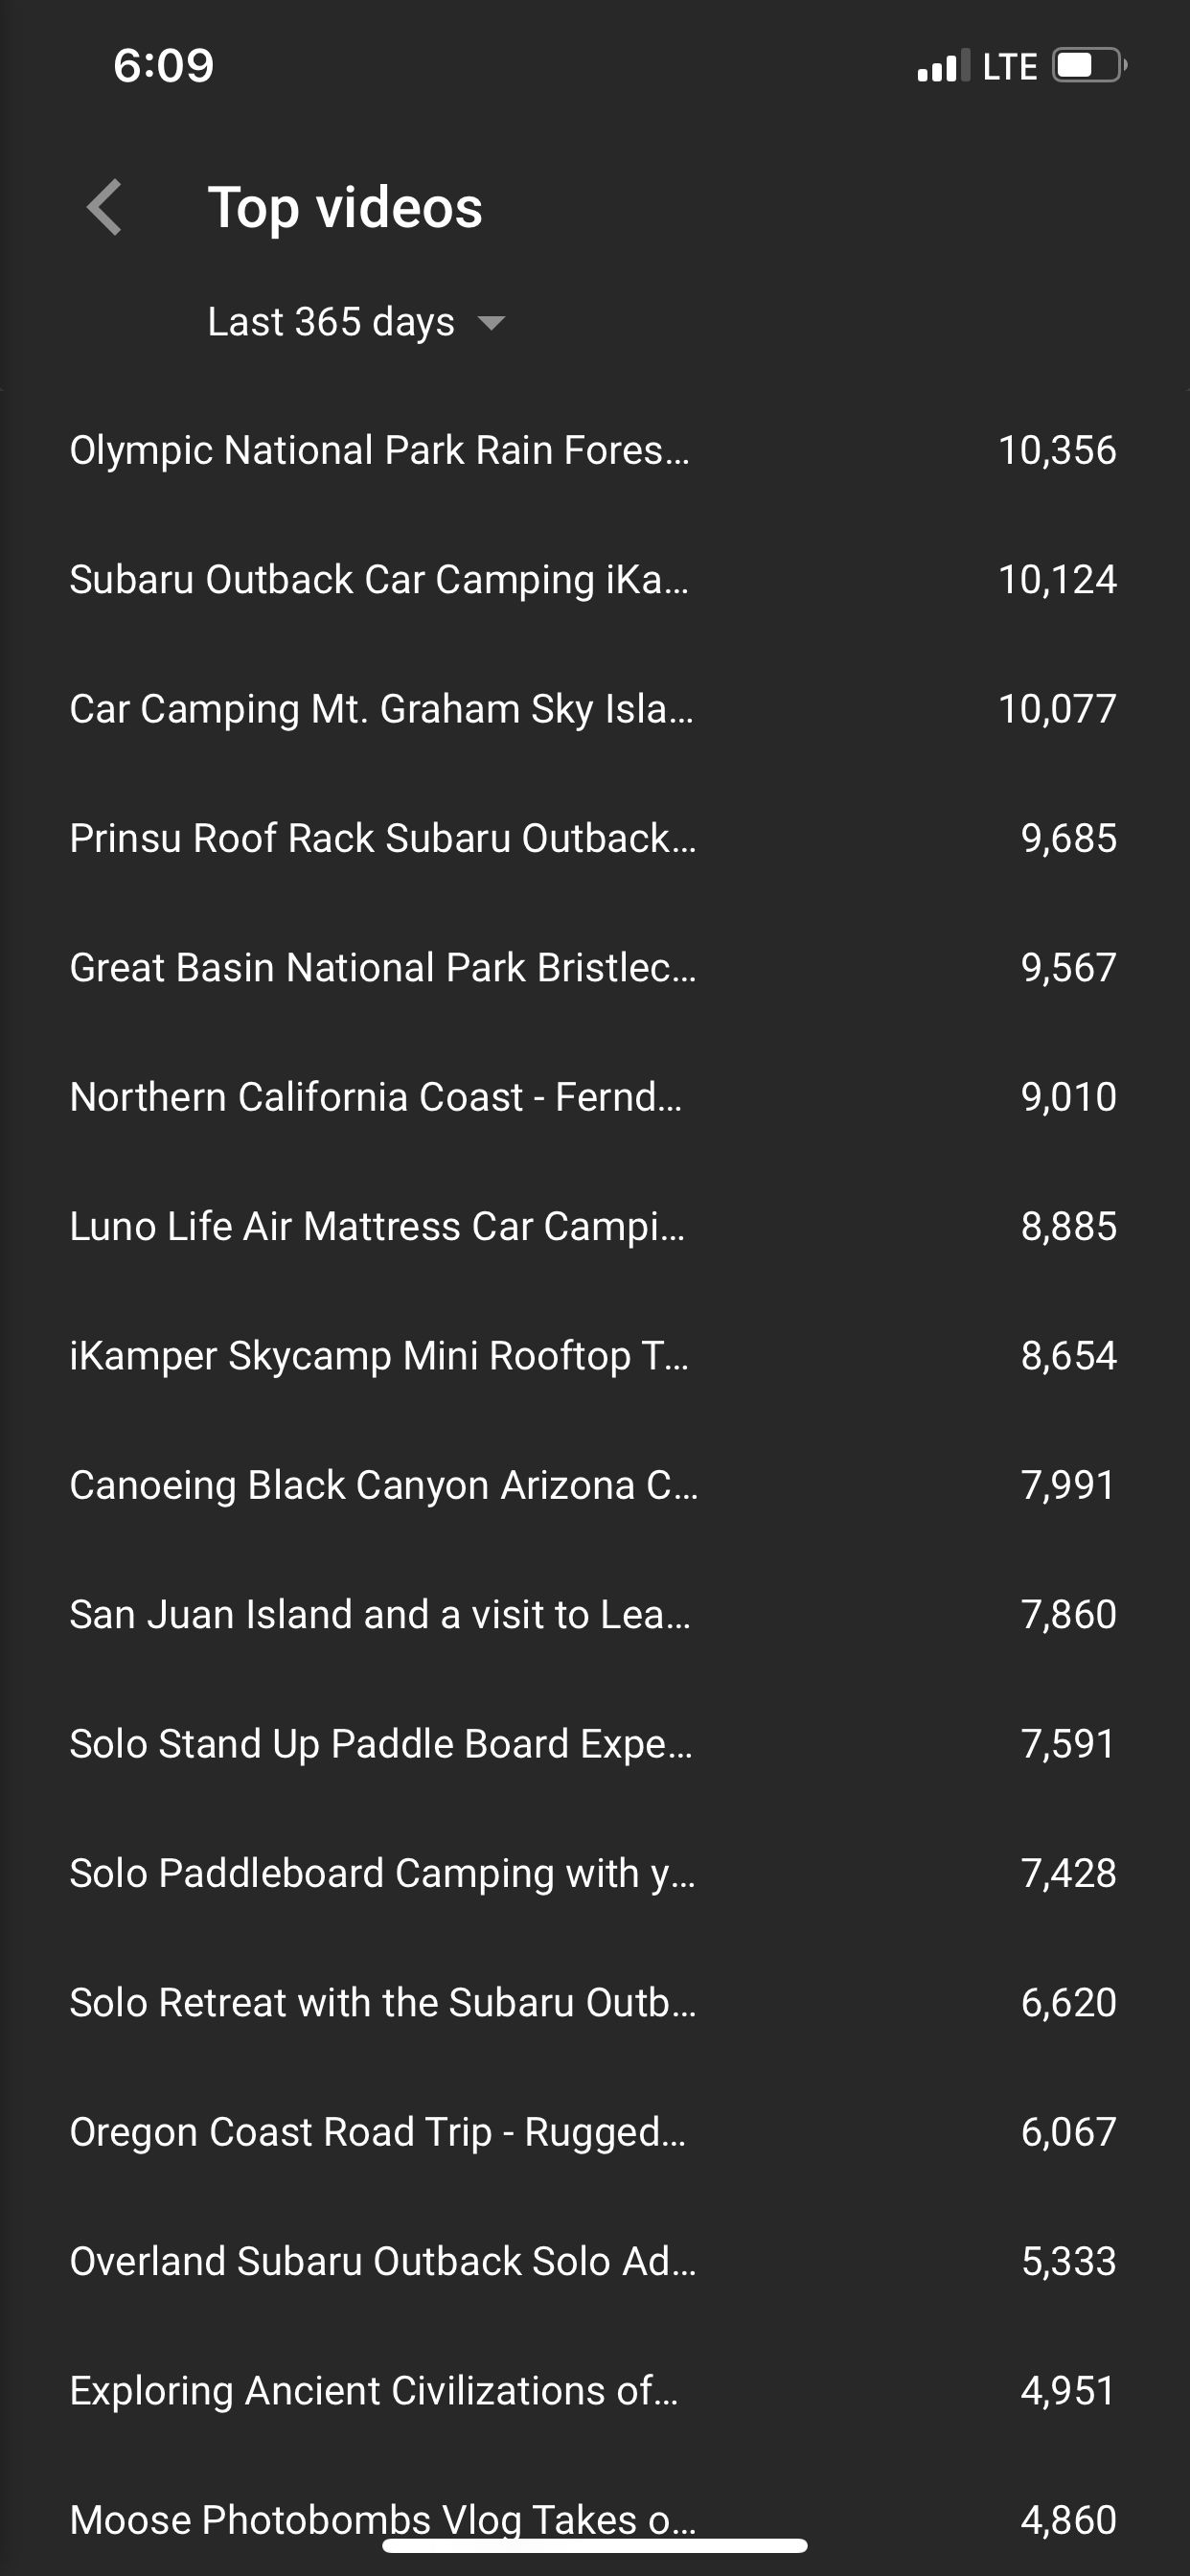
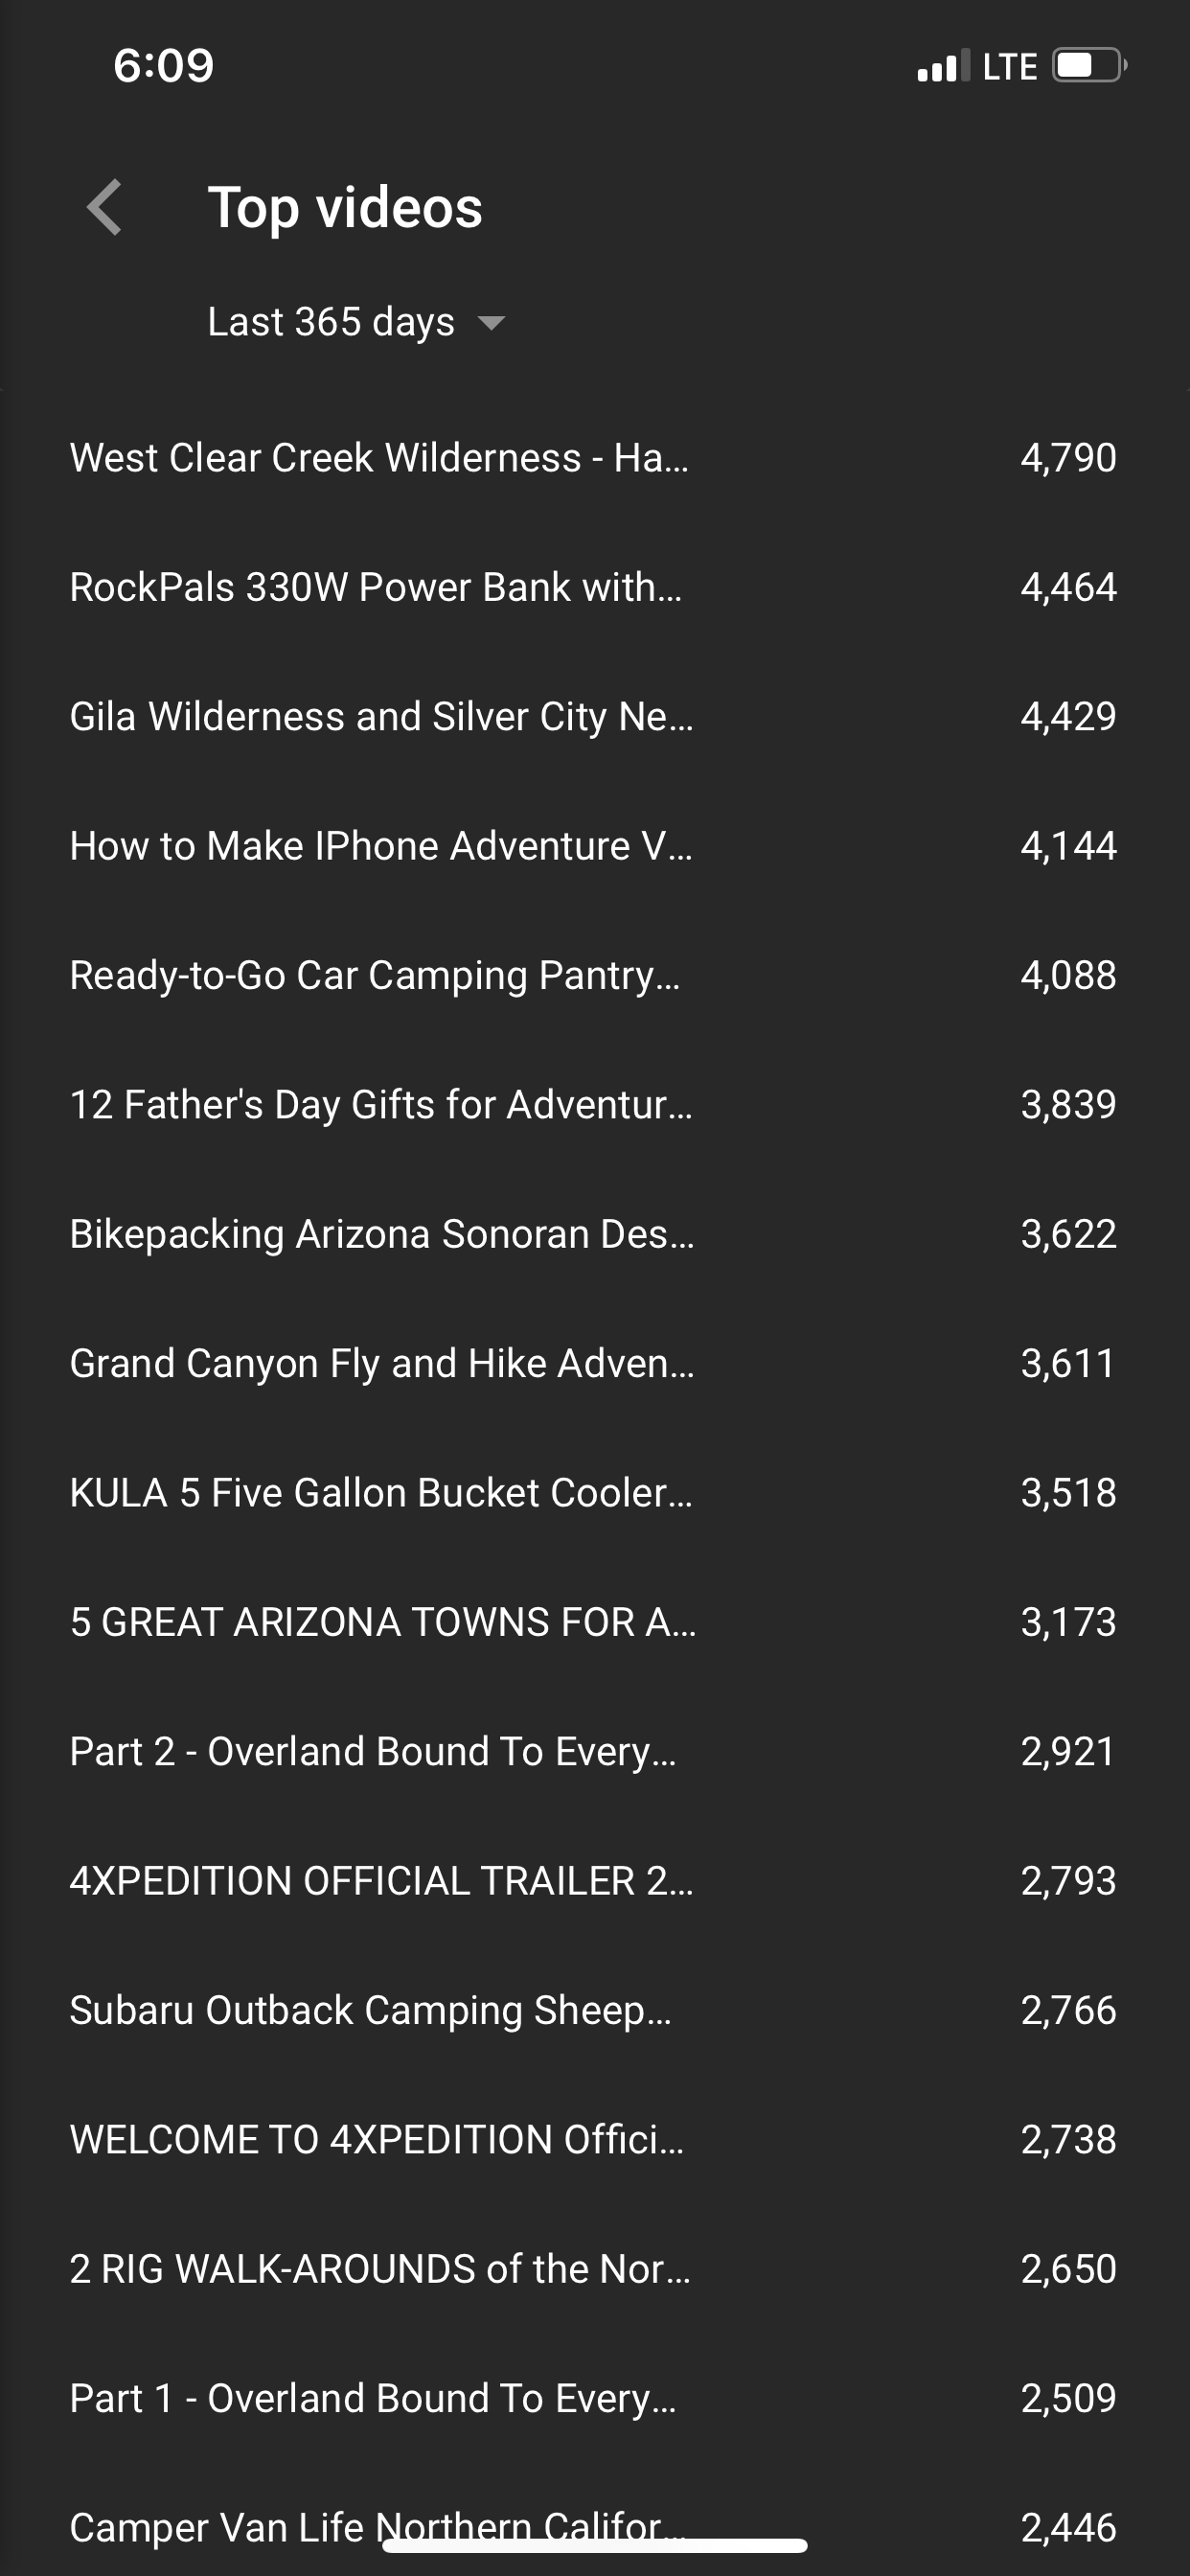
The three screen shots above show the top performing videos over the last 365 days. As you can see, in the top 5 are mostly vehicle focused videos. That would suggest that I should produce more vehicle centric videos. I can, but I also refrain a bit from doing that. Why? Because I choose to be more diverse in my offerings even at the expense of subject centric viewership growth because I am building a channel and brand that isn’t particular to one thing like “Subaru” or “Ram Truck”. This is because in the long run I don’t want to lose the viewers from something as simple as changing what I drive. My channel focus is all-around adventure. Yes, people have found me because of my Subaru, but they stay for other reasons. The vehicles are simply a hook.
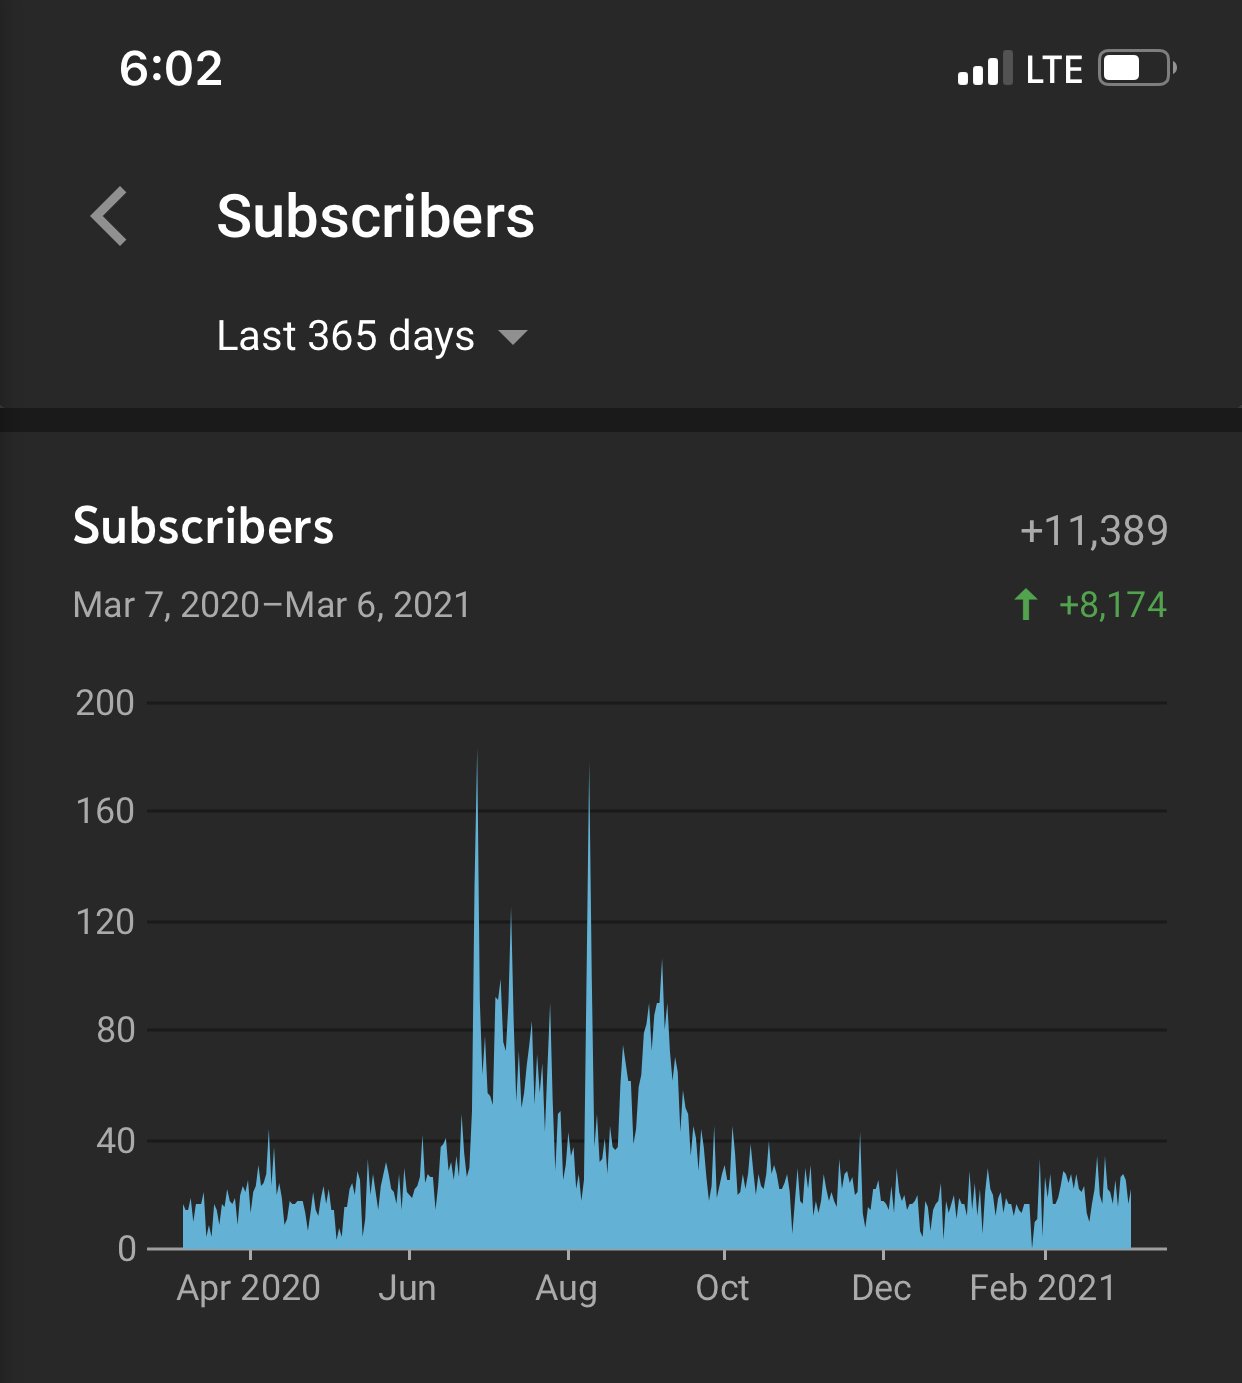
The chart above shows my subscriber trend over the last 365 days. As you can see, because I put out quality continent consistently over the summer that people wanted to watch, my subscriber base jumped up a lot. For a while, over the summer, I was hitting about 2000 new subscribers a month. Of course, that tapered way off after summer because I wasn’t consistently posting videos and they weren’t as epic as the national park videos I was creating over the summer. This is an area of my channel growth that I’m most focused on—building a base of people who really like my content because these are the people who will eventually also sign up to become members of TEAM 4X.
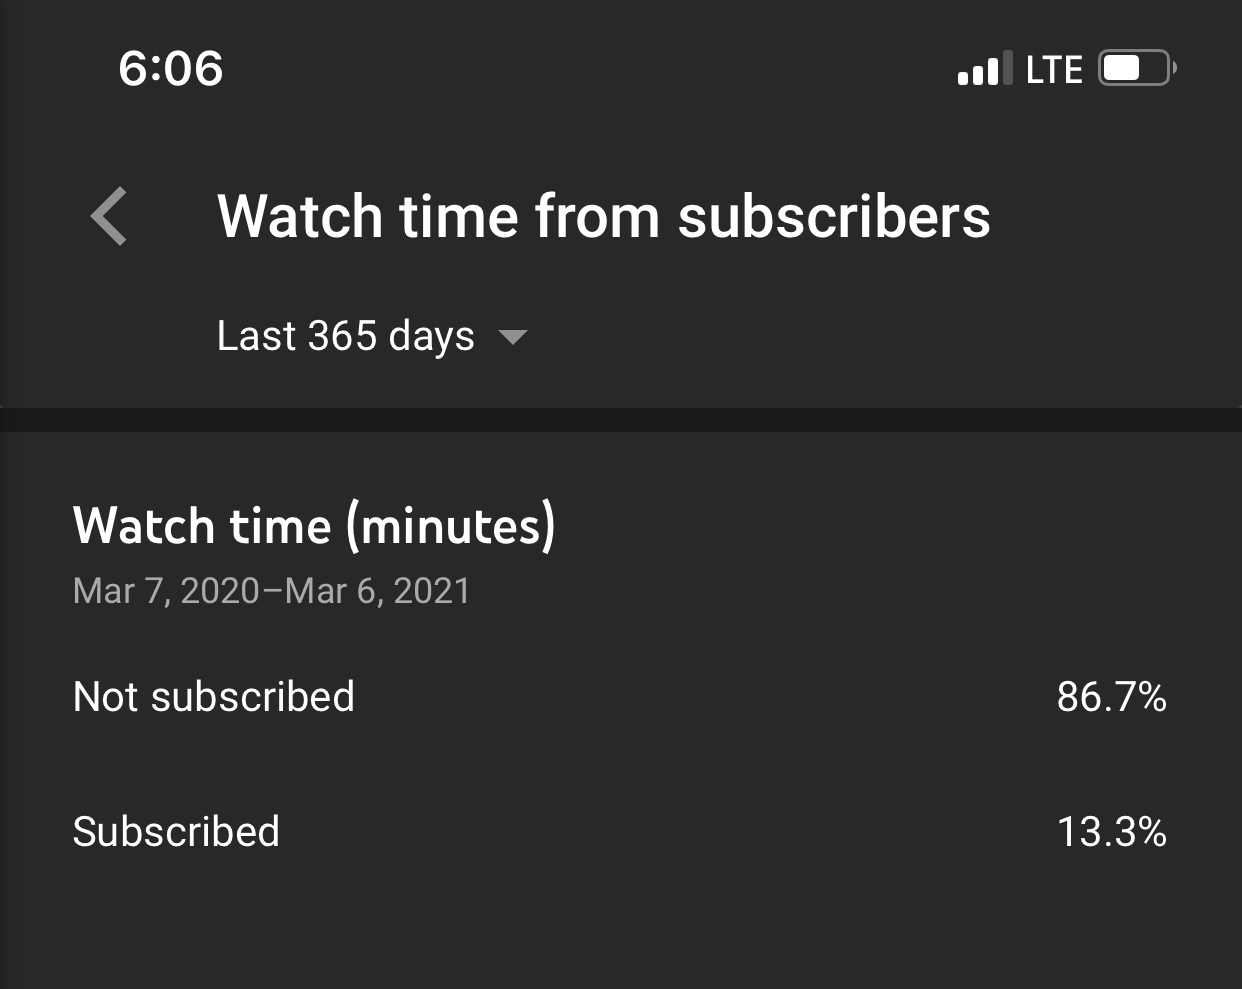
As you can see here, over the last 365 days my viewership has been predominately non-subscribed viewers. It’s a big goal of mine this year to Increase the subscribed viewership. The only way to do that is to get more subscribers.
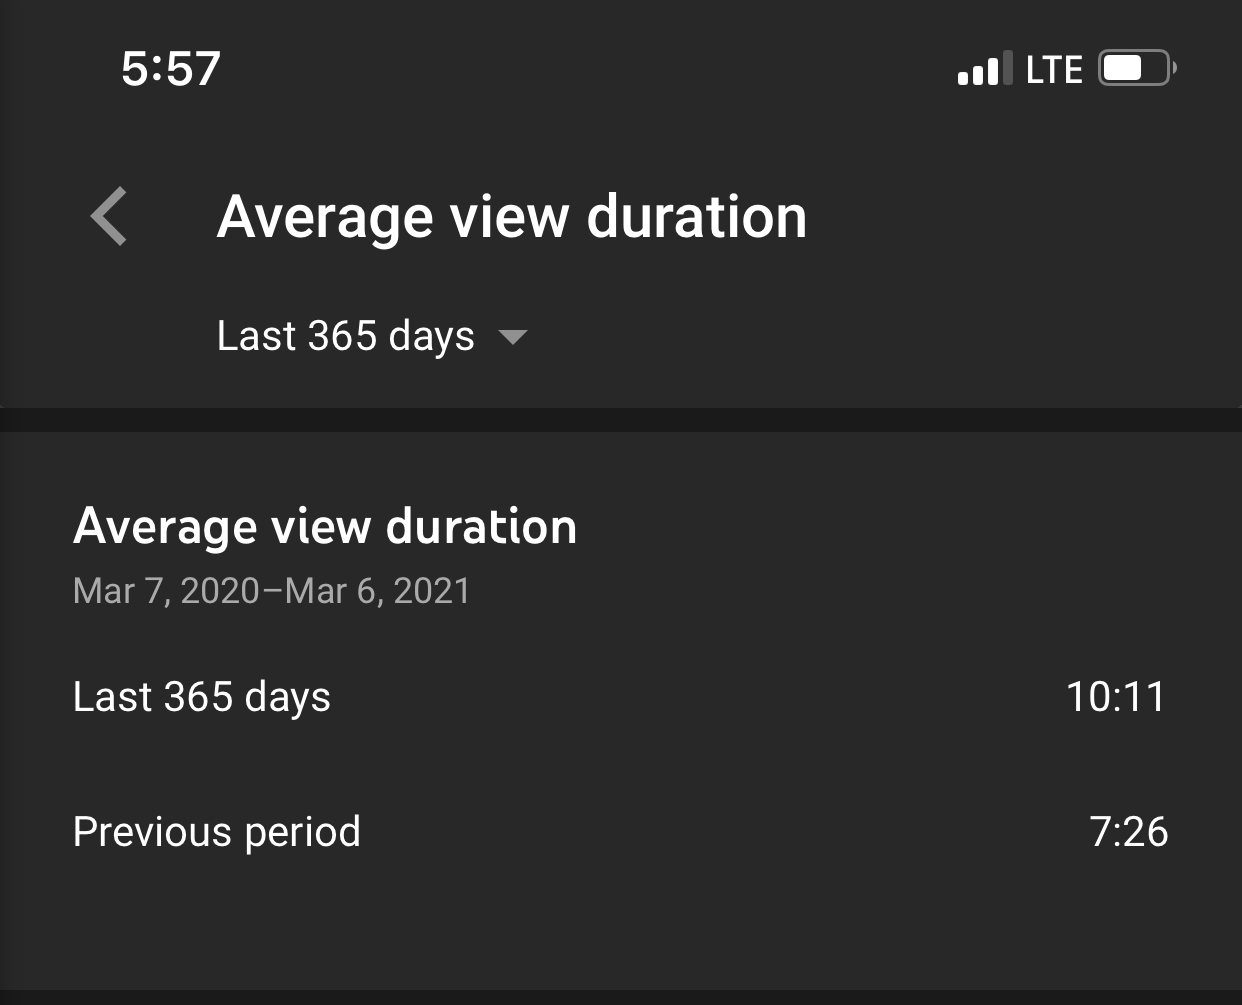
This chart shows The average length of time someone spent watching a video of mine over the last 365 days versus the previous year. My goal this year of course is to beat the last 365 days. This is done by creating quality content that is engaging and keeps people interested and doing so consistently.
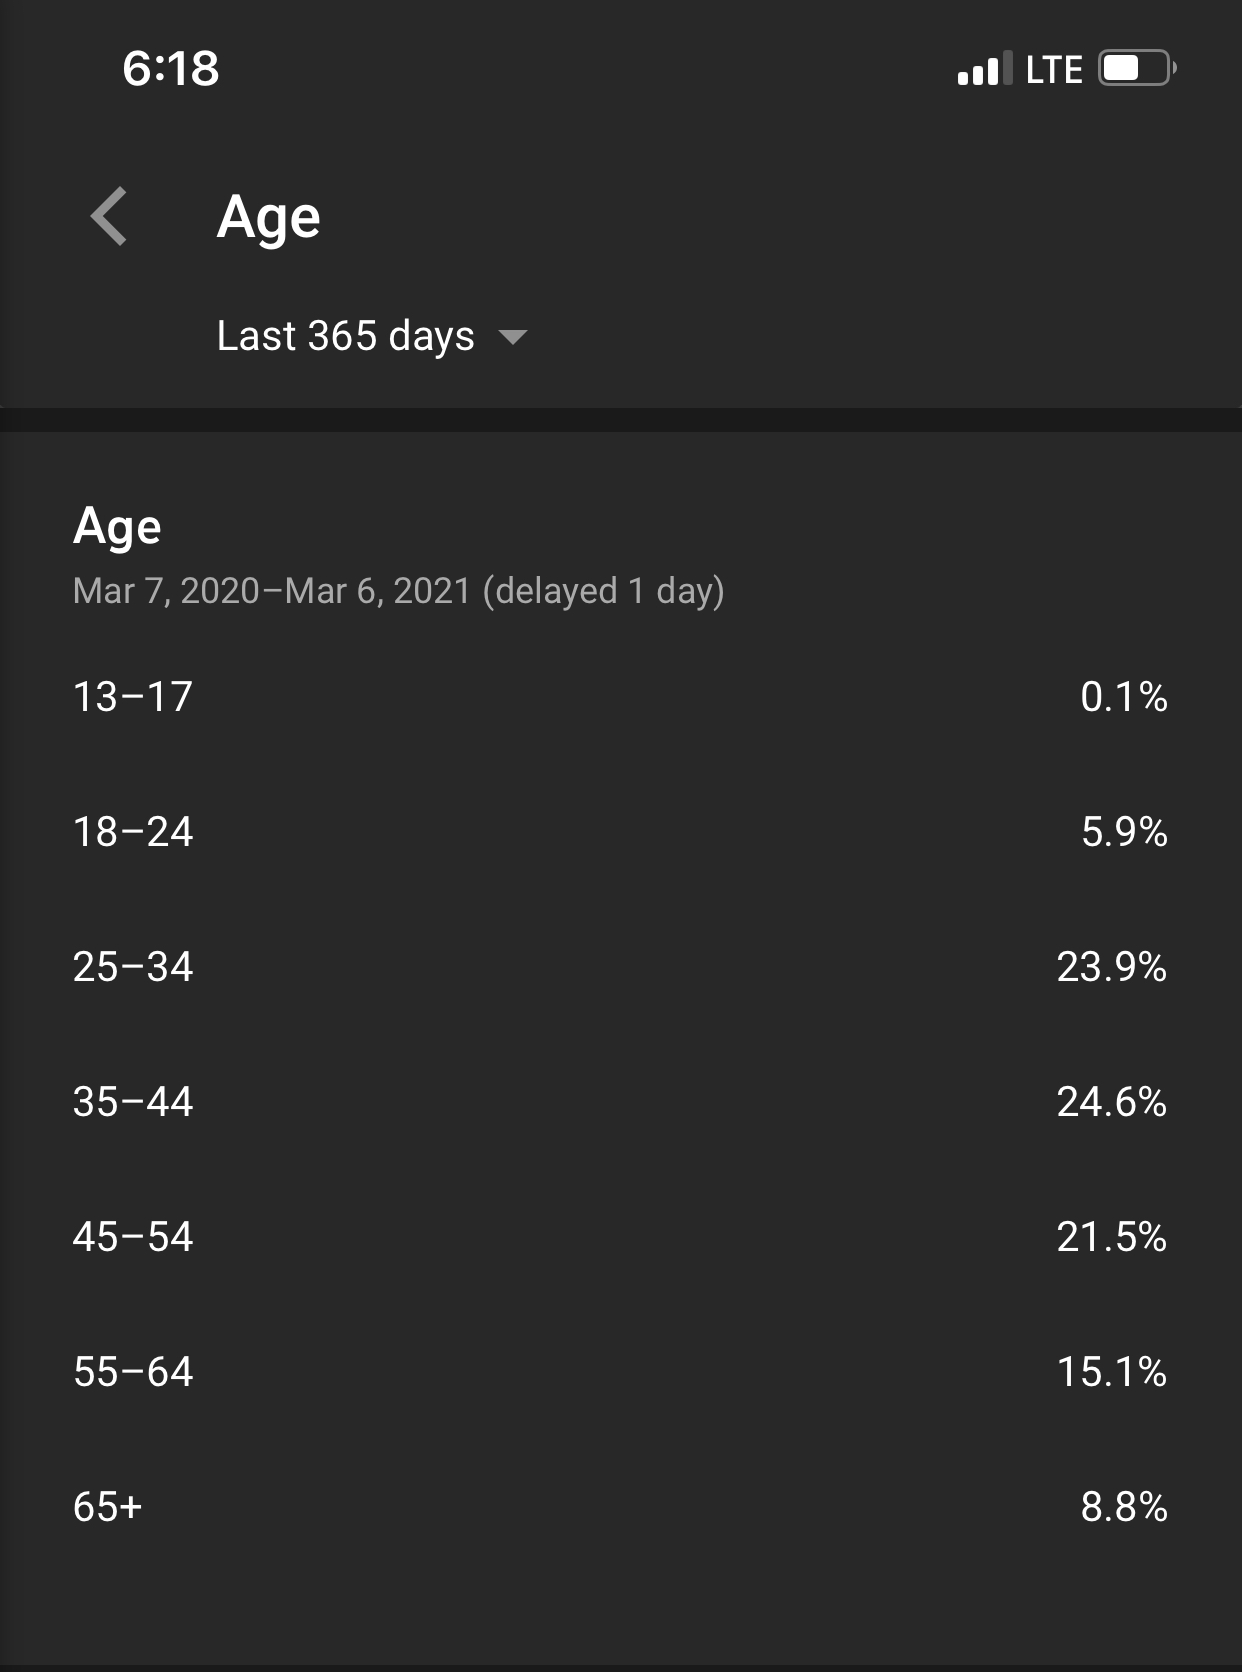
This chart shows the average age range of my viewers over the last 365 days. An interesting statistic especially when negotiating deals with partners who want to know everything they can about the exposure a channel can provide them when investing in marketing across all of their channels.
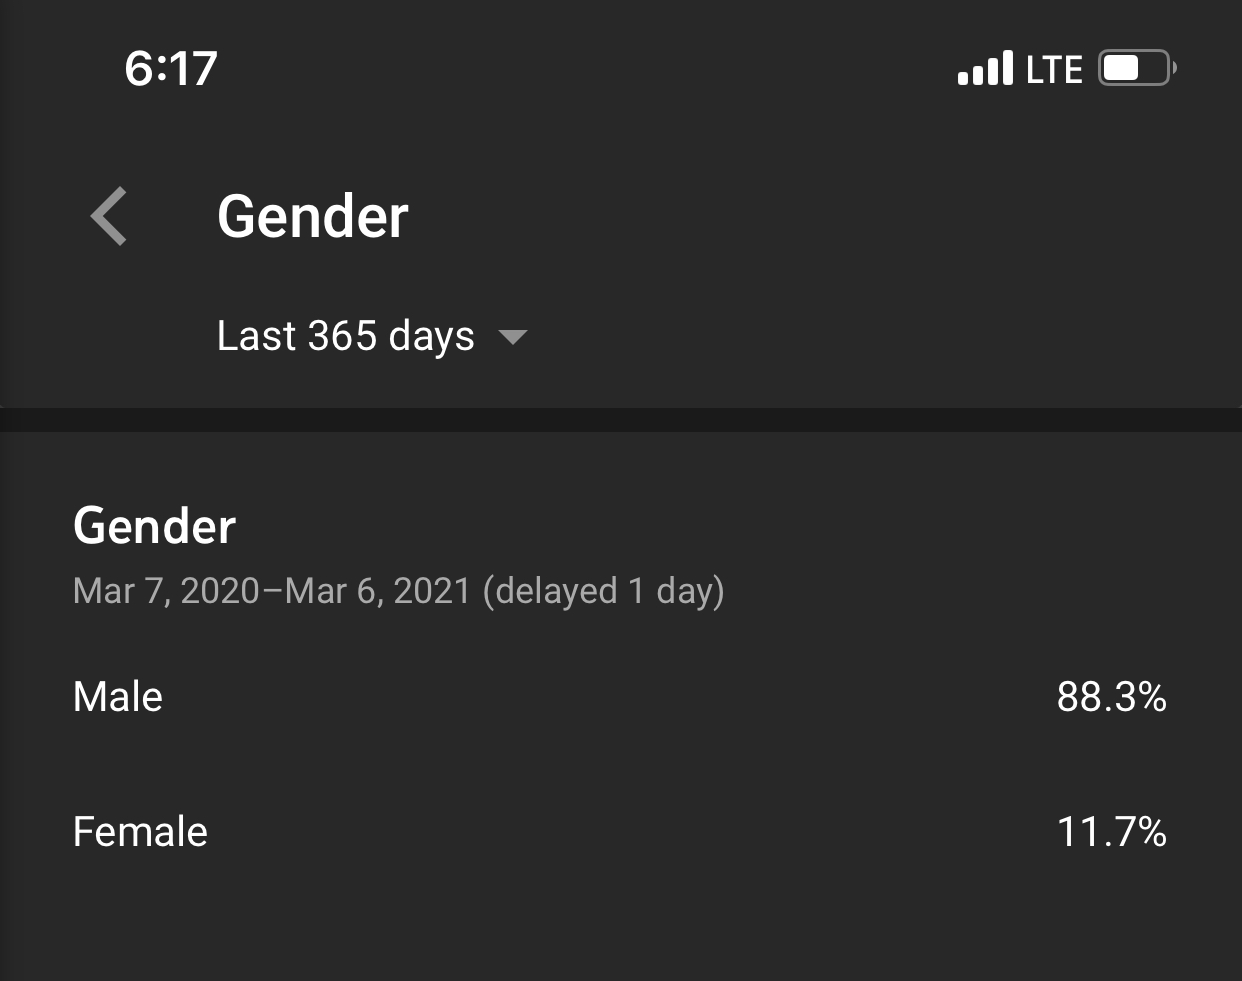
The chart above shows the (male and female) gender breakdown of my viewers over the last 365 days. This is a statistic I am proud of. I have talked to many other channel owners as well as a number of marketing professionals in the outdoor space and, generally speaking, a channel like mine typically is almost 100% male viewership. My goal this year is to continue to increase the female viewership of my channel as I feel there is no particular single-gender focus of my channel. This may be done by encouraging females to participate in my videos. I intend to increase the number of both male and female guests in my videos and on my adventures this year.
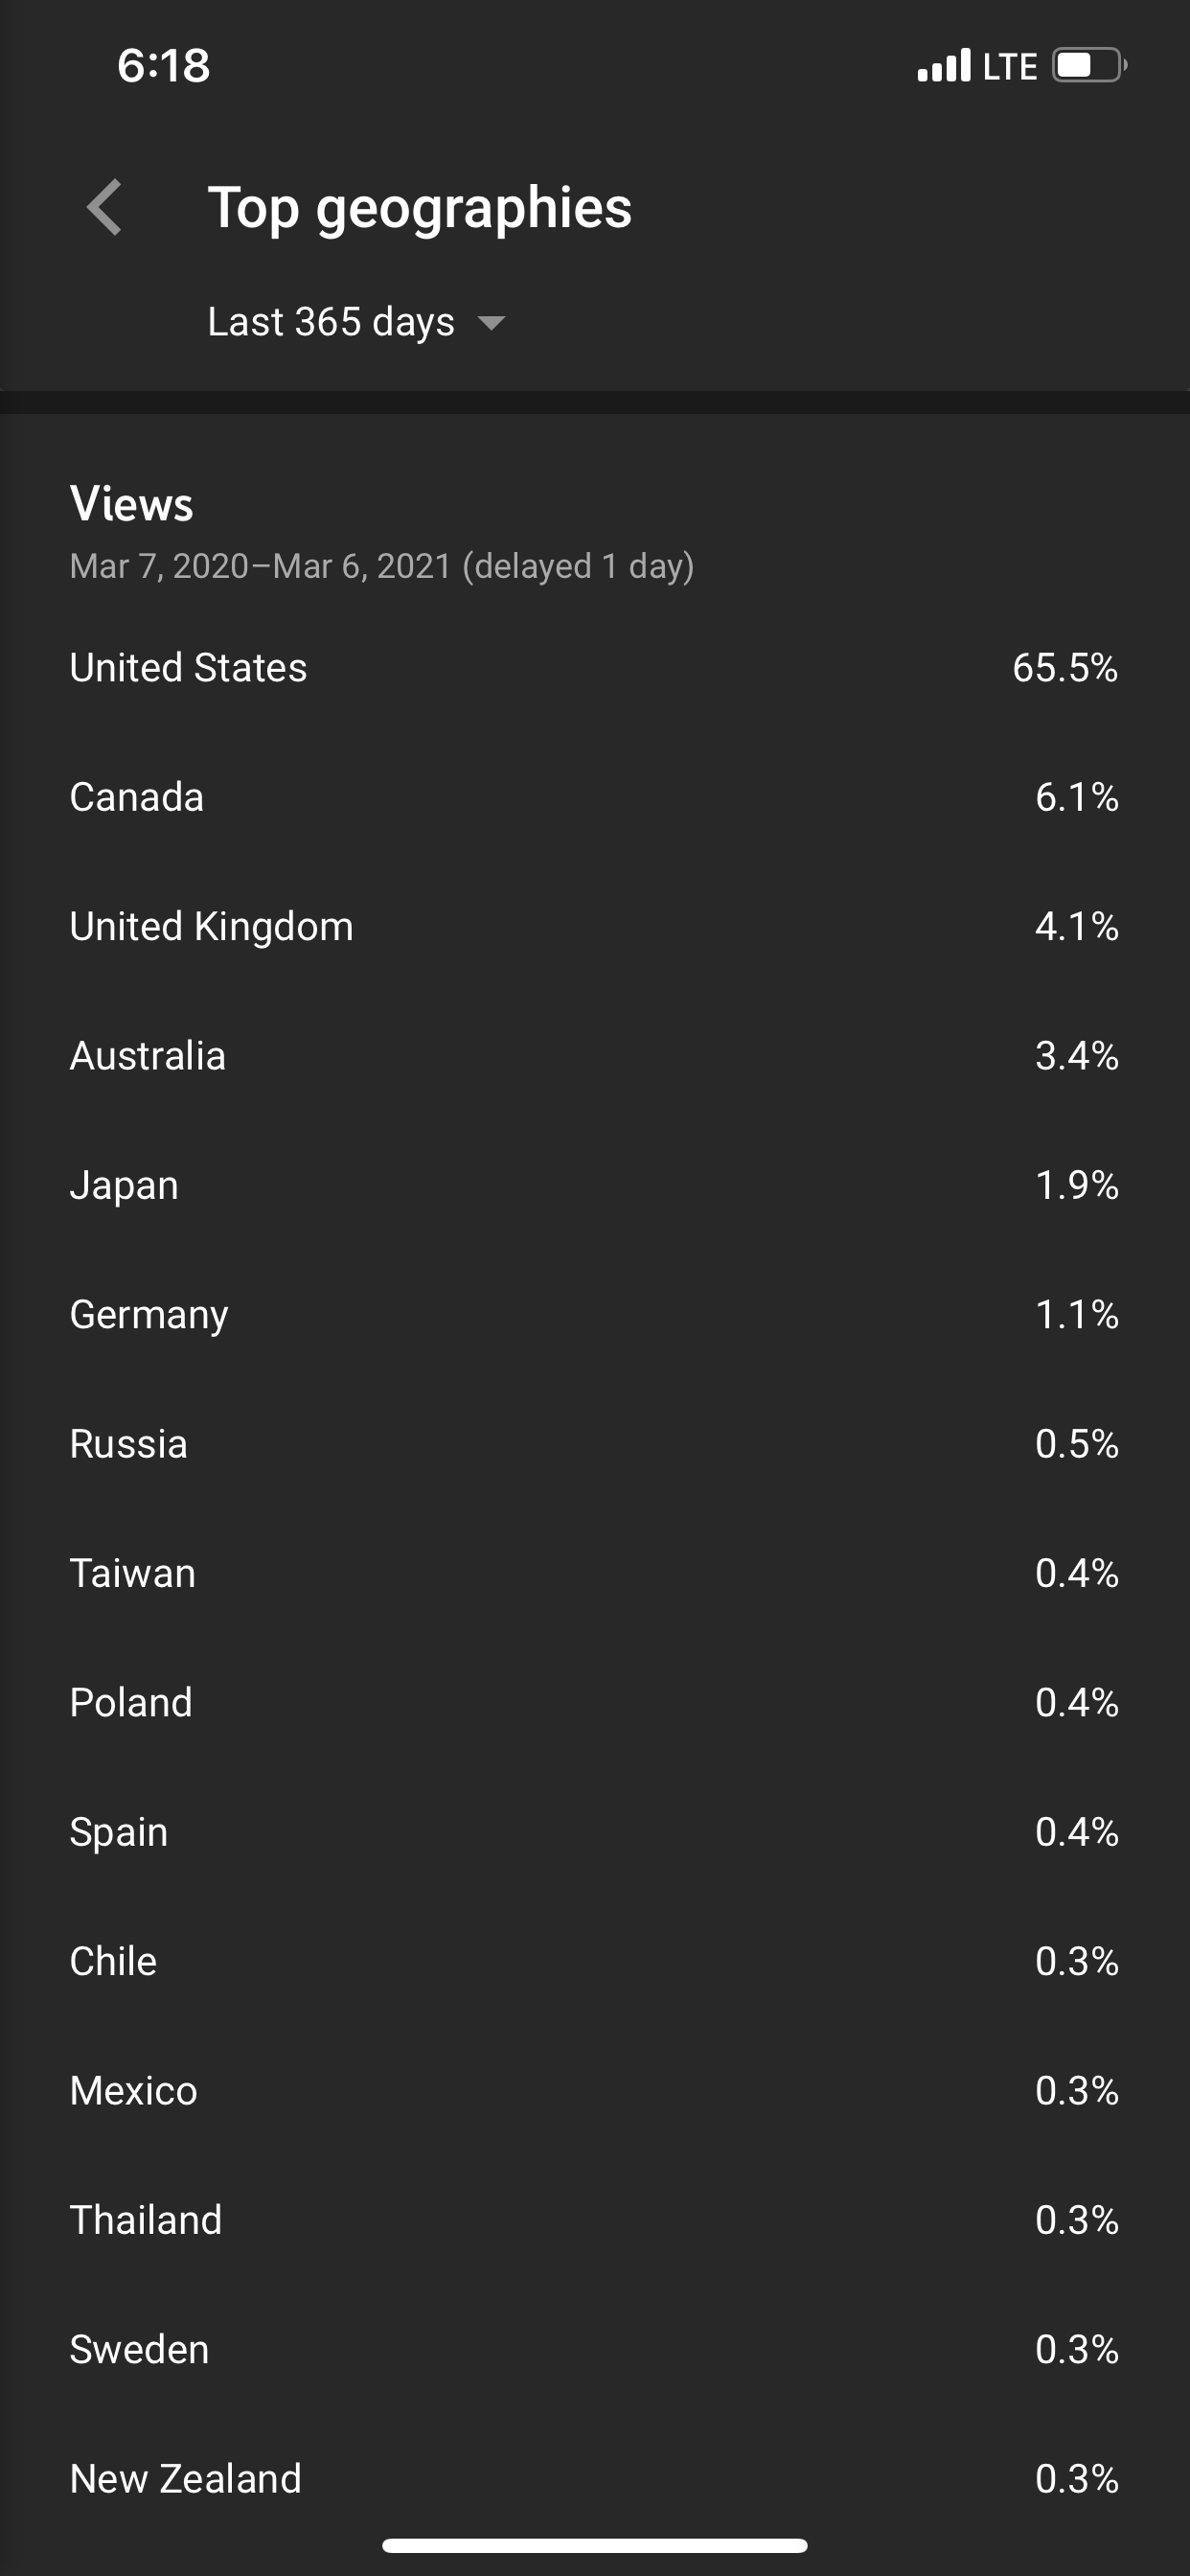
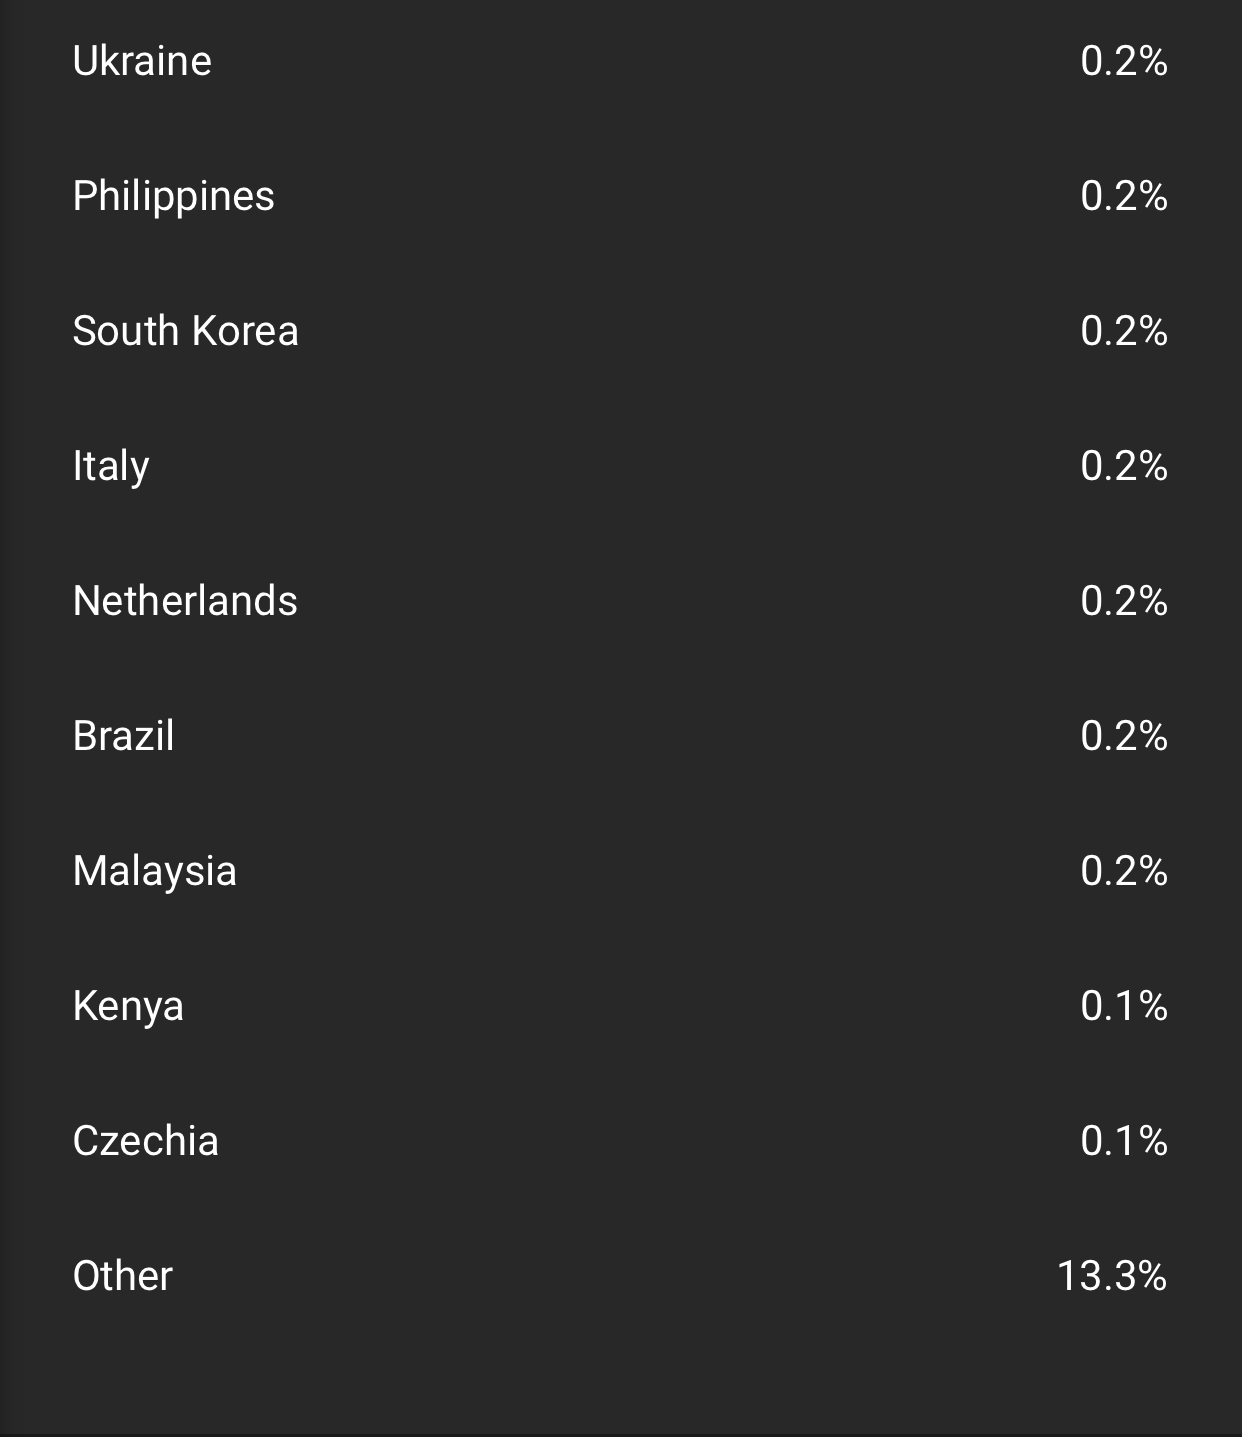
The top two screenshots show the geographical statistics of my viewership over the last 365 days. I am very happy to see that my channel is viewed by individuals across so many regions of the world. In fact, my channel is viewed by people in over 50 countries. My top 6 are generally pretty consistent–usually USA, Canada, UK, Australia, Germany, and Japan.
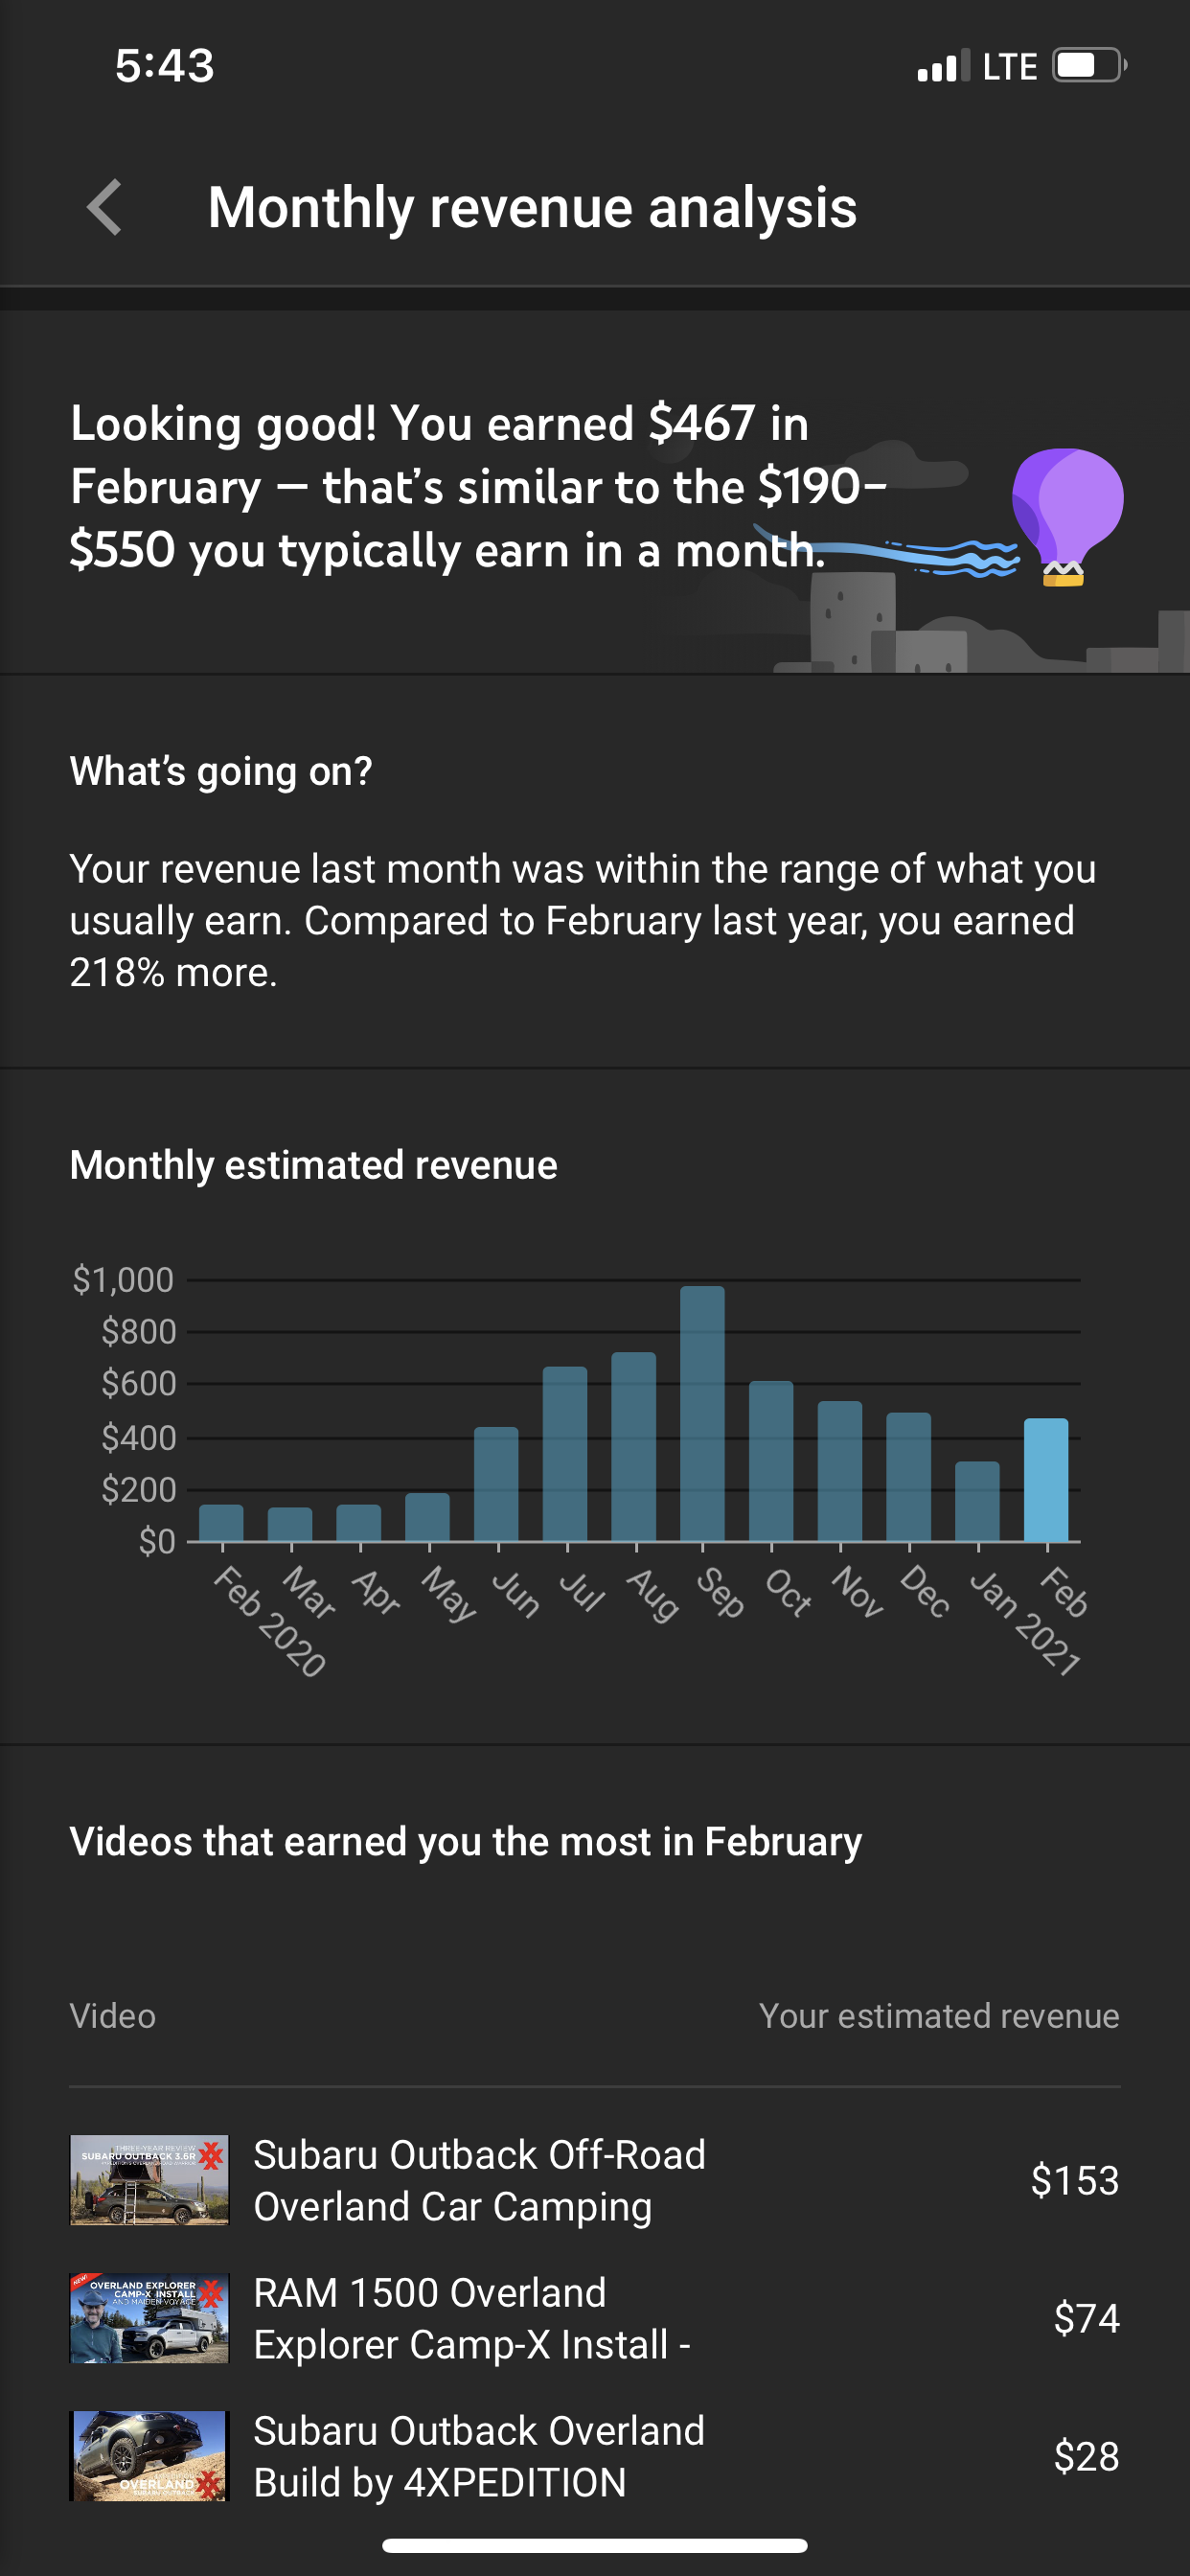
So looking at the report above, the important thing to point out is February earnings this year compared to February last year. Also note the upward trend last year spring to the summer months and where I am this year vs last year predicts that in the summer if I am producing quality content will trend up over $1000 per month. Let’s hope. But note that I purchase advertising for many of my videos. About $100 per video to boost viewership and get more subscribers. So, this isn’t take home. Basically right now I am reinvesting my earnings back into the channel. That’s ok because that means it’s not coming out of my pocket. Purchasing advertising helps boost a video faster and the faster the viewership increases the more likely a video will trend and be shared by YouTube on the suggested videos page, home page, and other pages YouTube offers content.
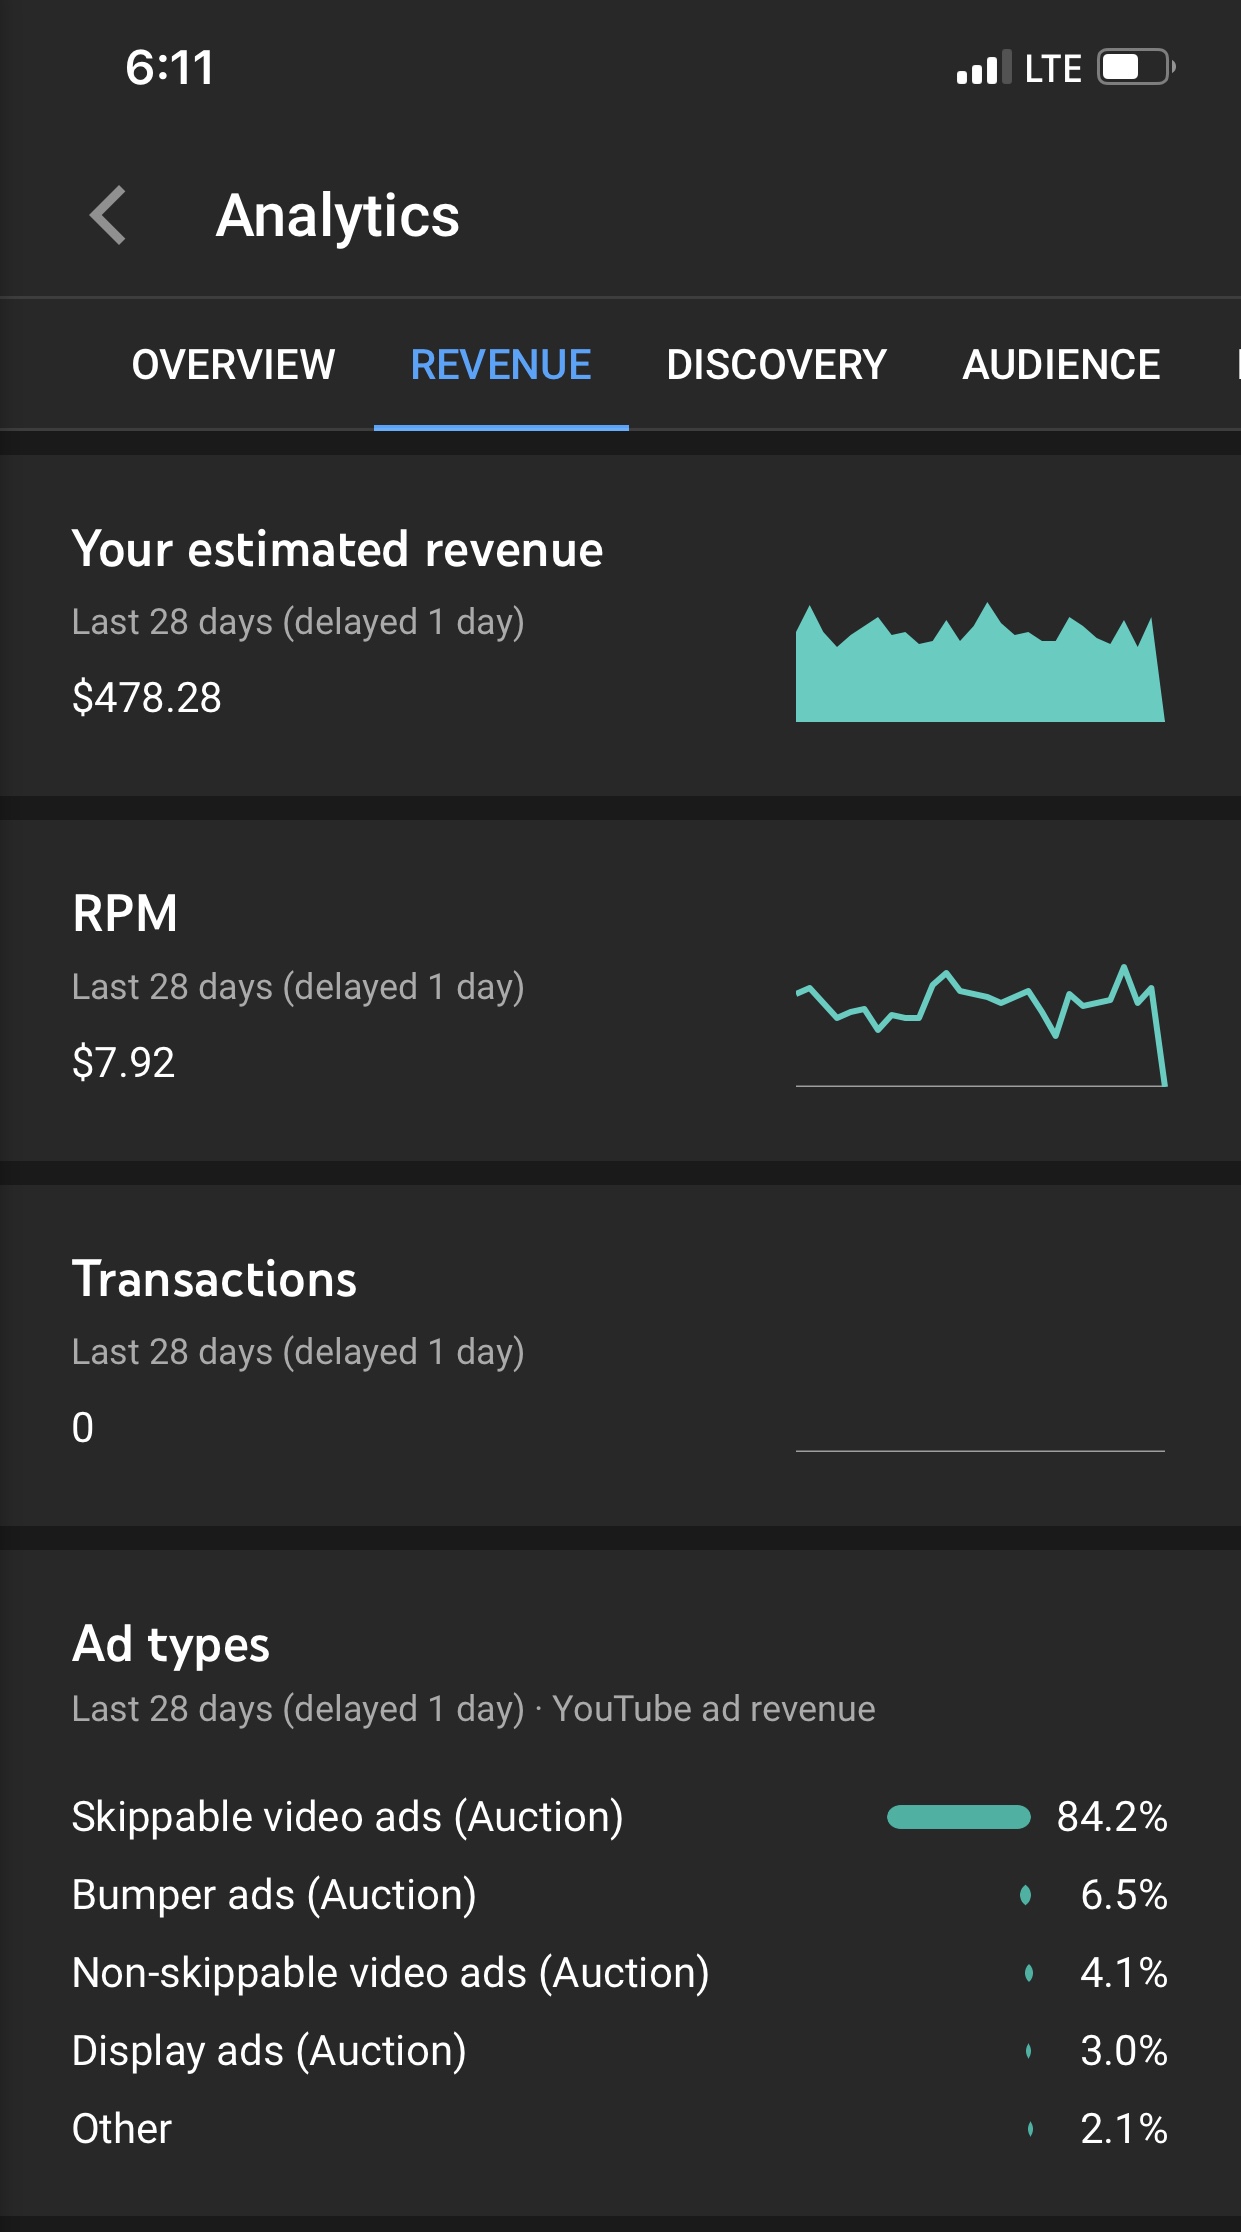
As you can see, the YouTube analytics breaks down your estimated monthly revenue as well as your RPM, or Revenue Per Mille. This is a metric that represents how much money you’ve earned per 1,000 video views. RPM is based on multiple revenue sources including Ads, Channel Memberships, YouTube Premium revenue, Super Chat, and Super Stickers.
This screen also shows the Ad Type. I prefer skippable videos and I can set that preference in my admin. bumper ads are the ads that show before and after a video. I am very limiting on the number of ads I show in my videos. And, therefore, if I only have one ad in the middle of a video, YouTube can force me to show non-skippable videos and even sometimes force two to be shown in a row during that commercial break.
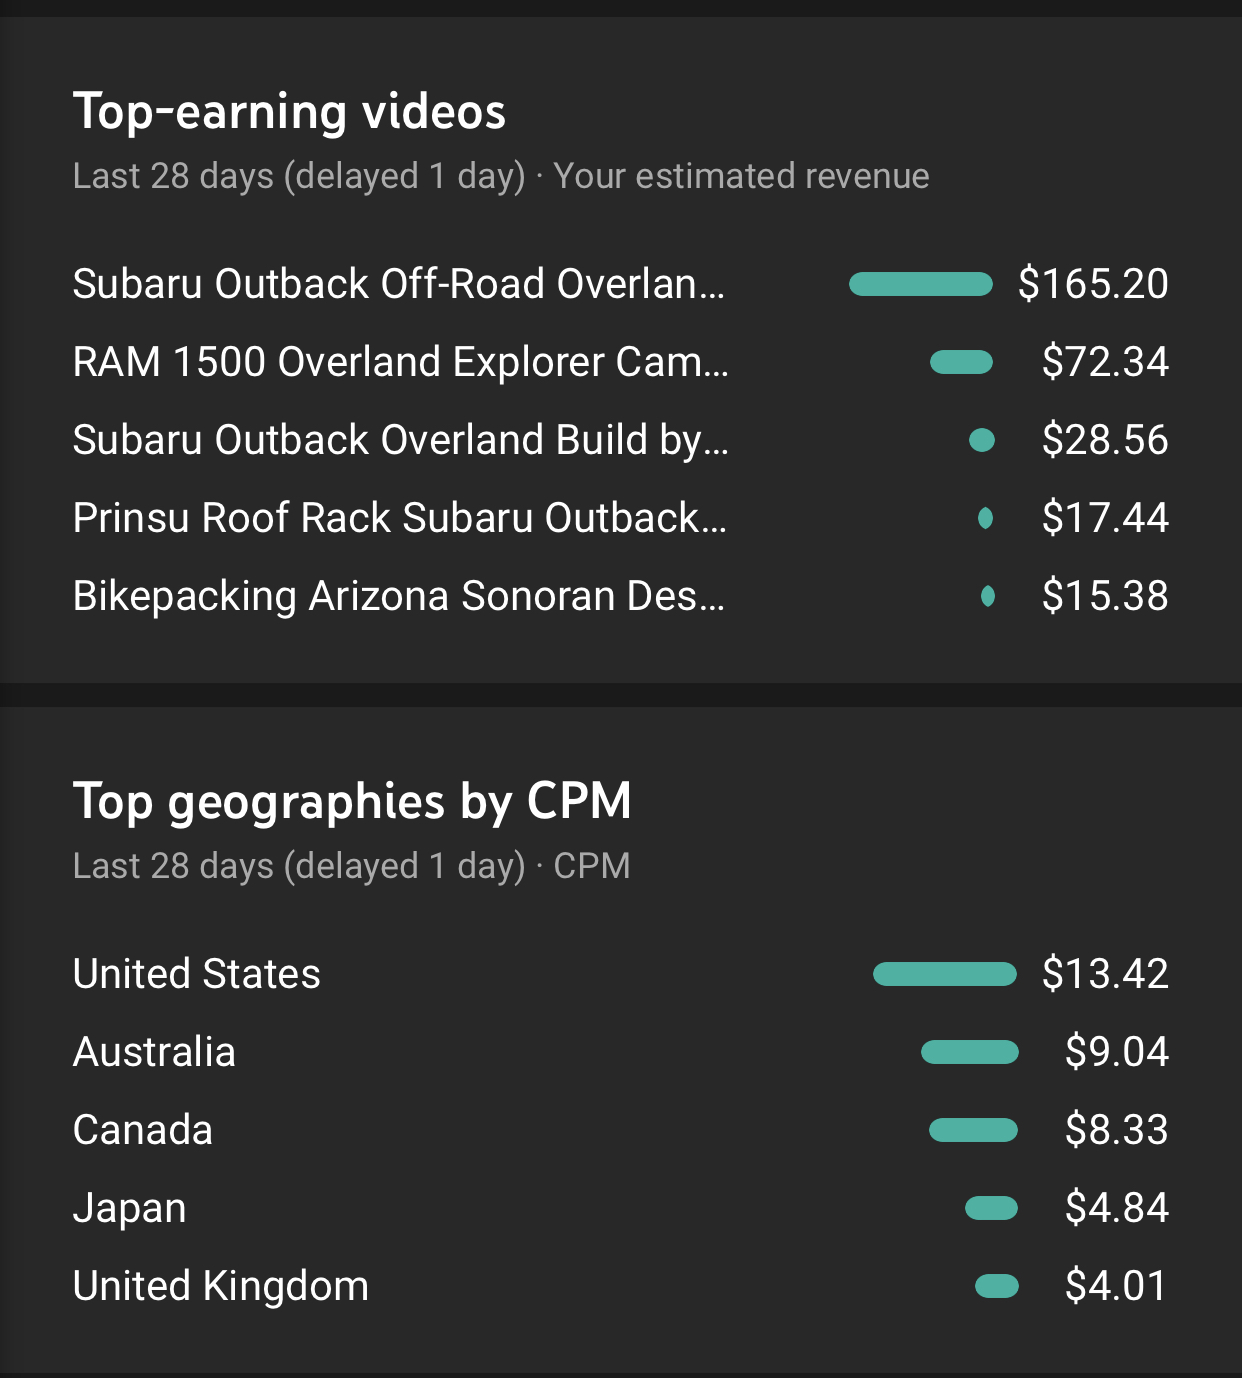
Continuing down the scrolling screen shot you see a brief snapshot of the top earning videos and how much they earned over the last 28 days as well as the top geographies by CPM. Most ad buys come down to the CPM which stands for Cost per 1,000 impressions. This is is a metric that represents how much money advertisers are spending to show ads on YouTube. You’ll see a few different CPM metrics in YouTube Analytics.
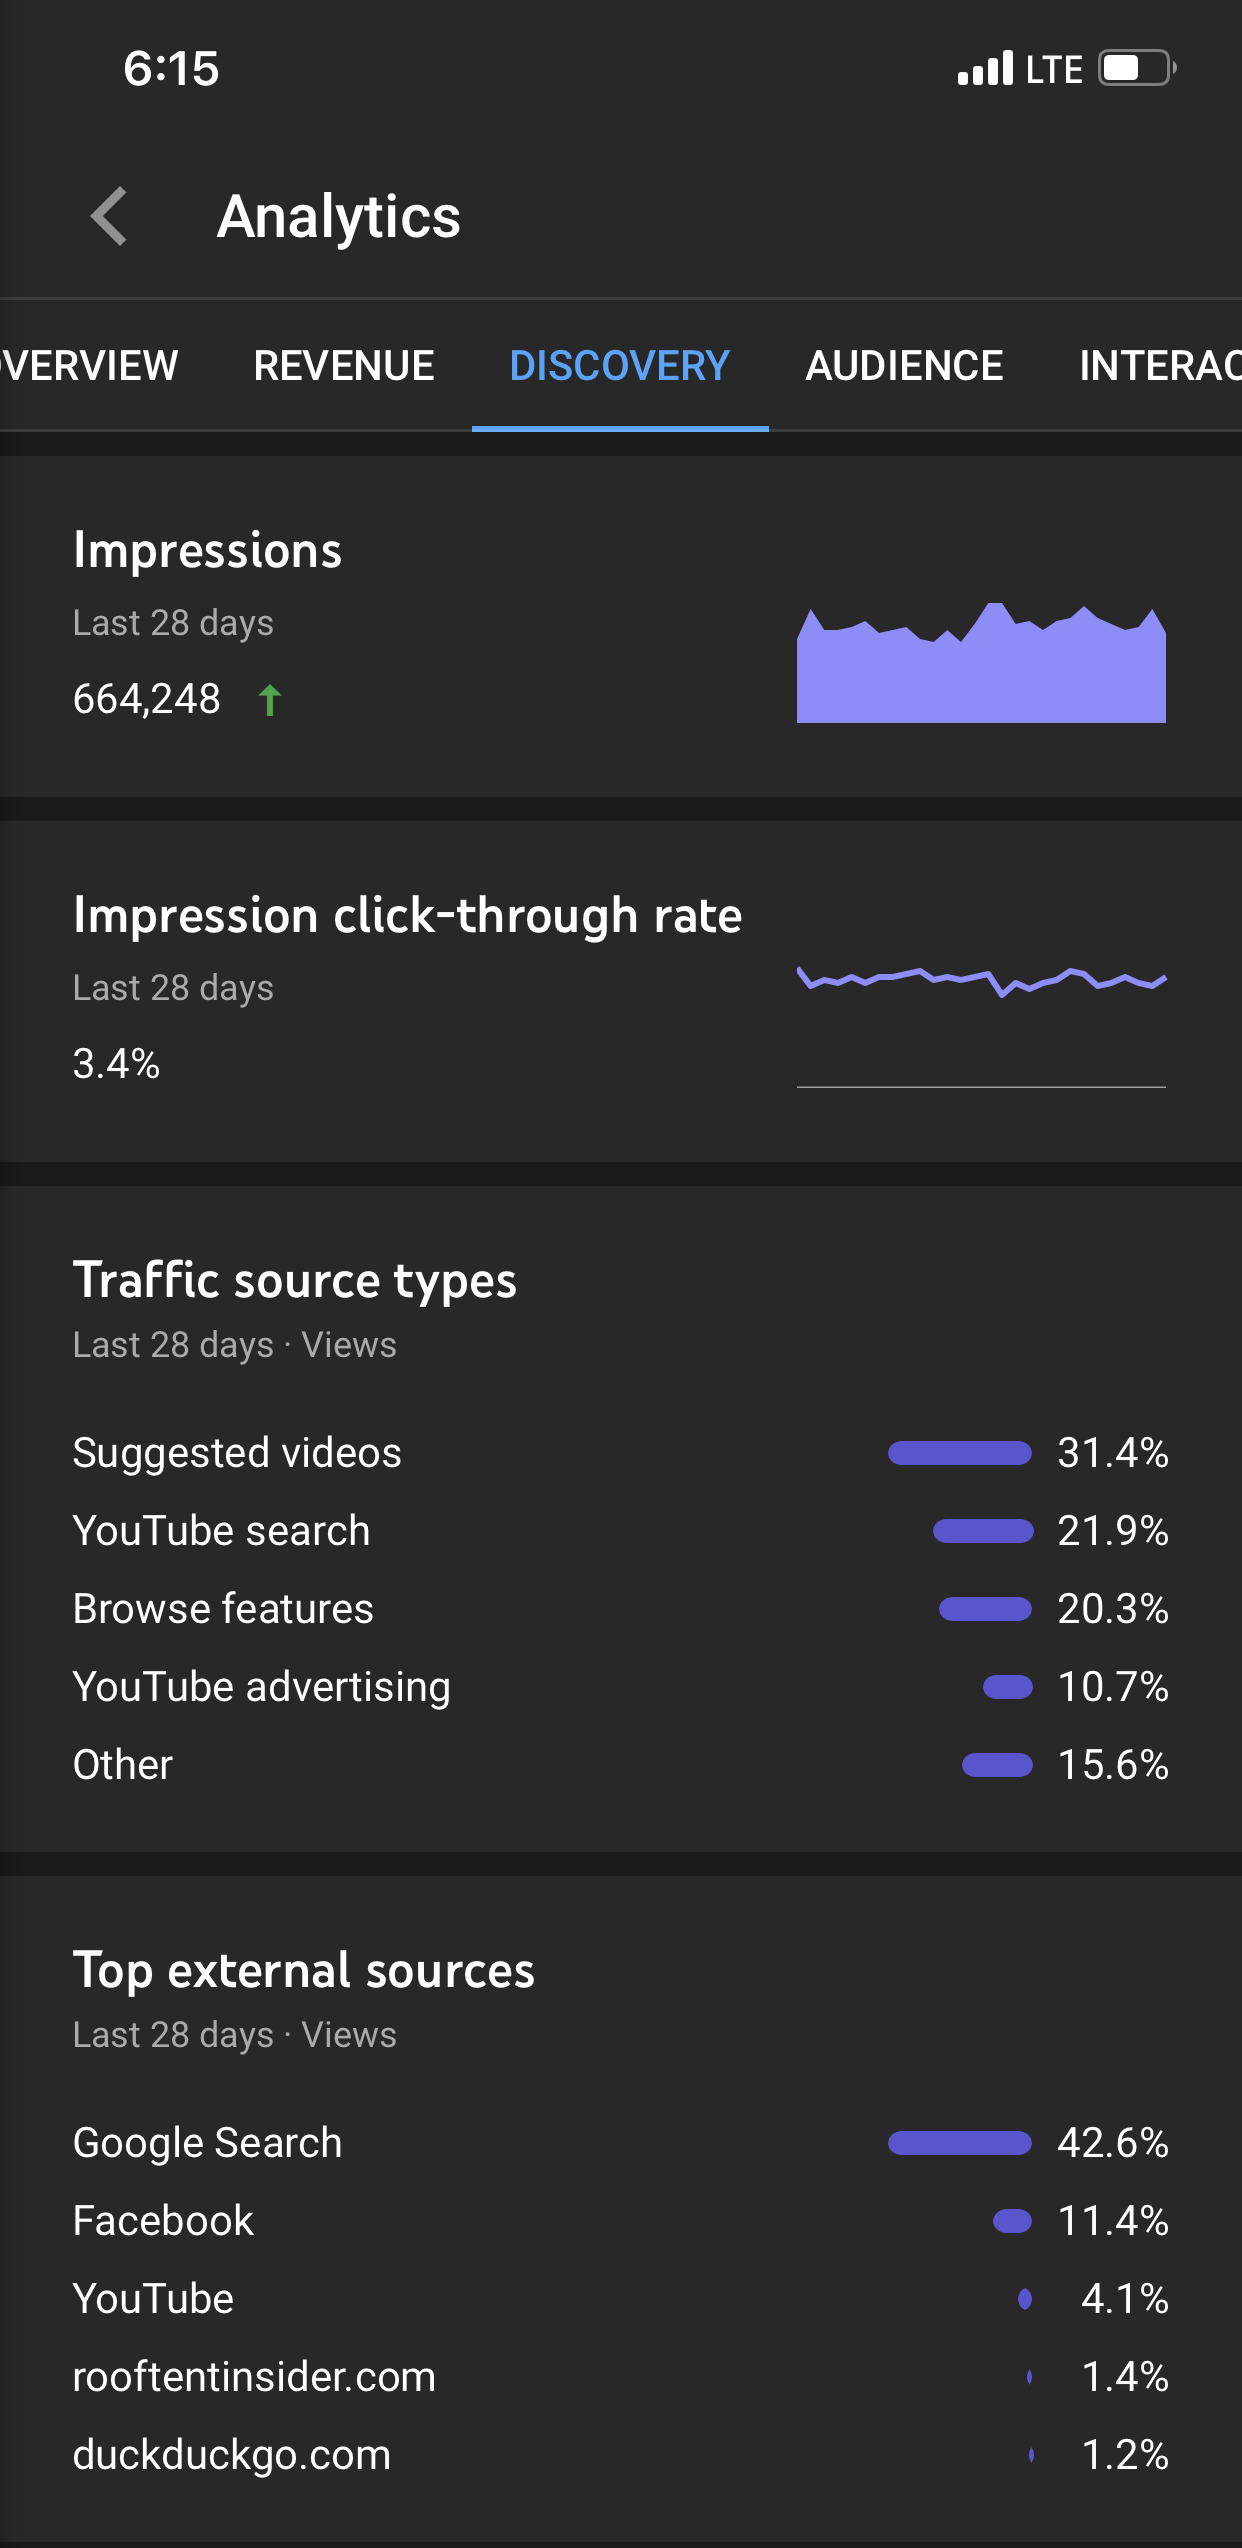
The screenshot above shows impressions. This statistic measures the number of times people saw your video in search results or on the YouTube home page or suggestion page. The faster a video trends, the more YouTube shows it. The more people click on the videos they suggest the more the algorithm includes it as a suggestion to other potential viewers and that is how a video goes viral. The greater the impression click-through rate, the more YouTube shares the video.
Further down you see Top External Sources. This view only shows you the top 5 but there are many more. This provides data on where people are coming from outside of YouTube to view the video. So, if I post a video link on Facebook or in a Facebook private interest group this report will show views from that source. If you share my Facebook post to your friends on your Facebook page or in a private group, that increases the viewership numbers here.
This also shows when other websites embed my video in their articles. So, I can then see how my videos are adding to other website’s content.
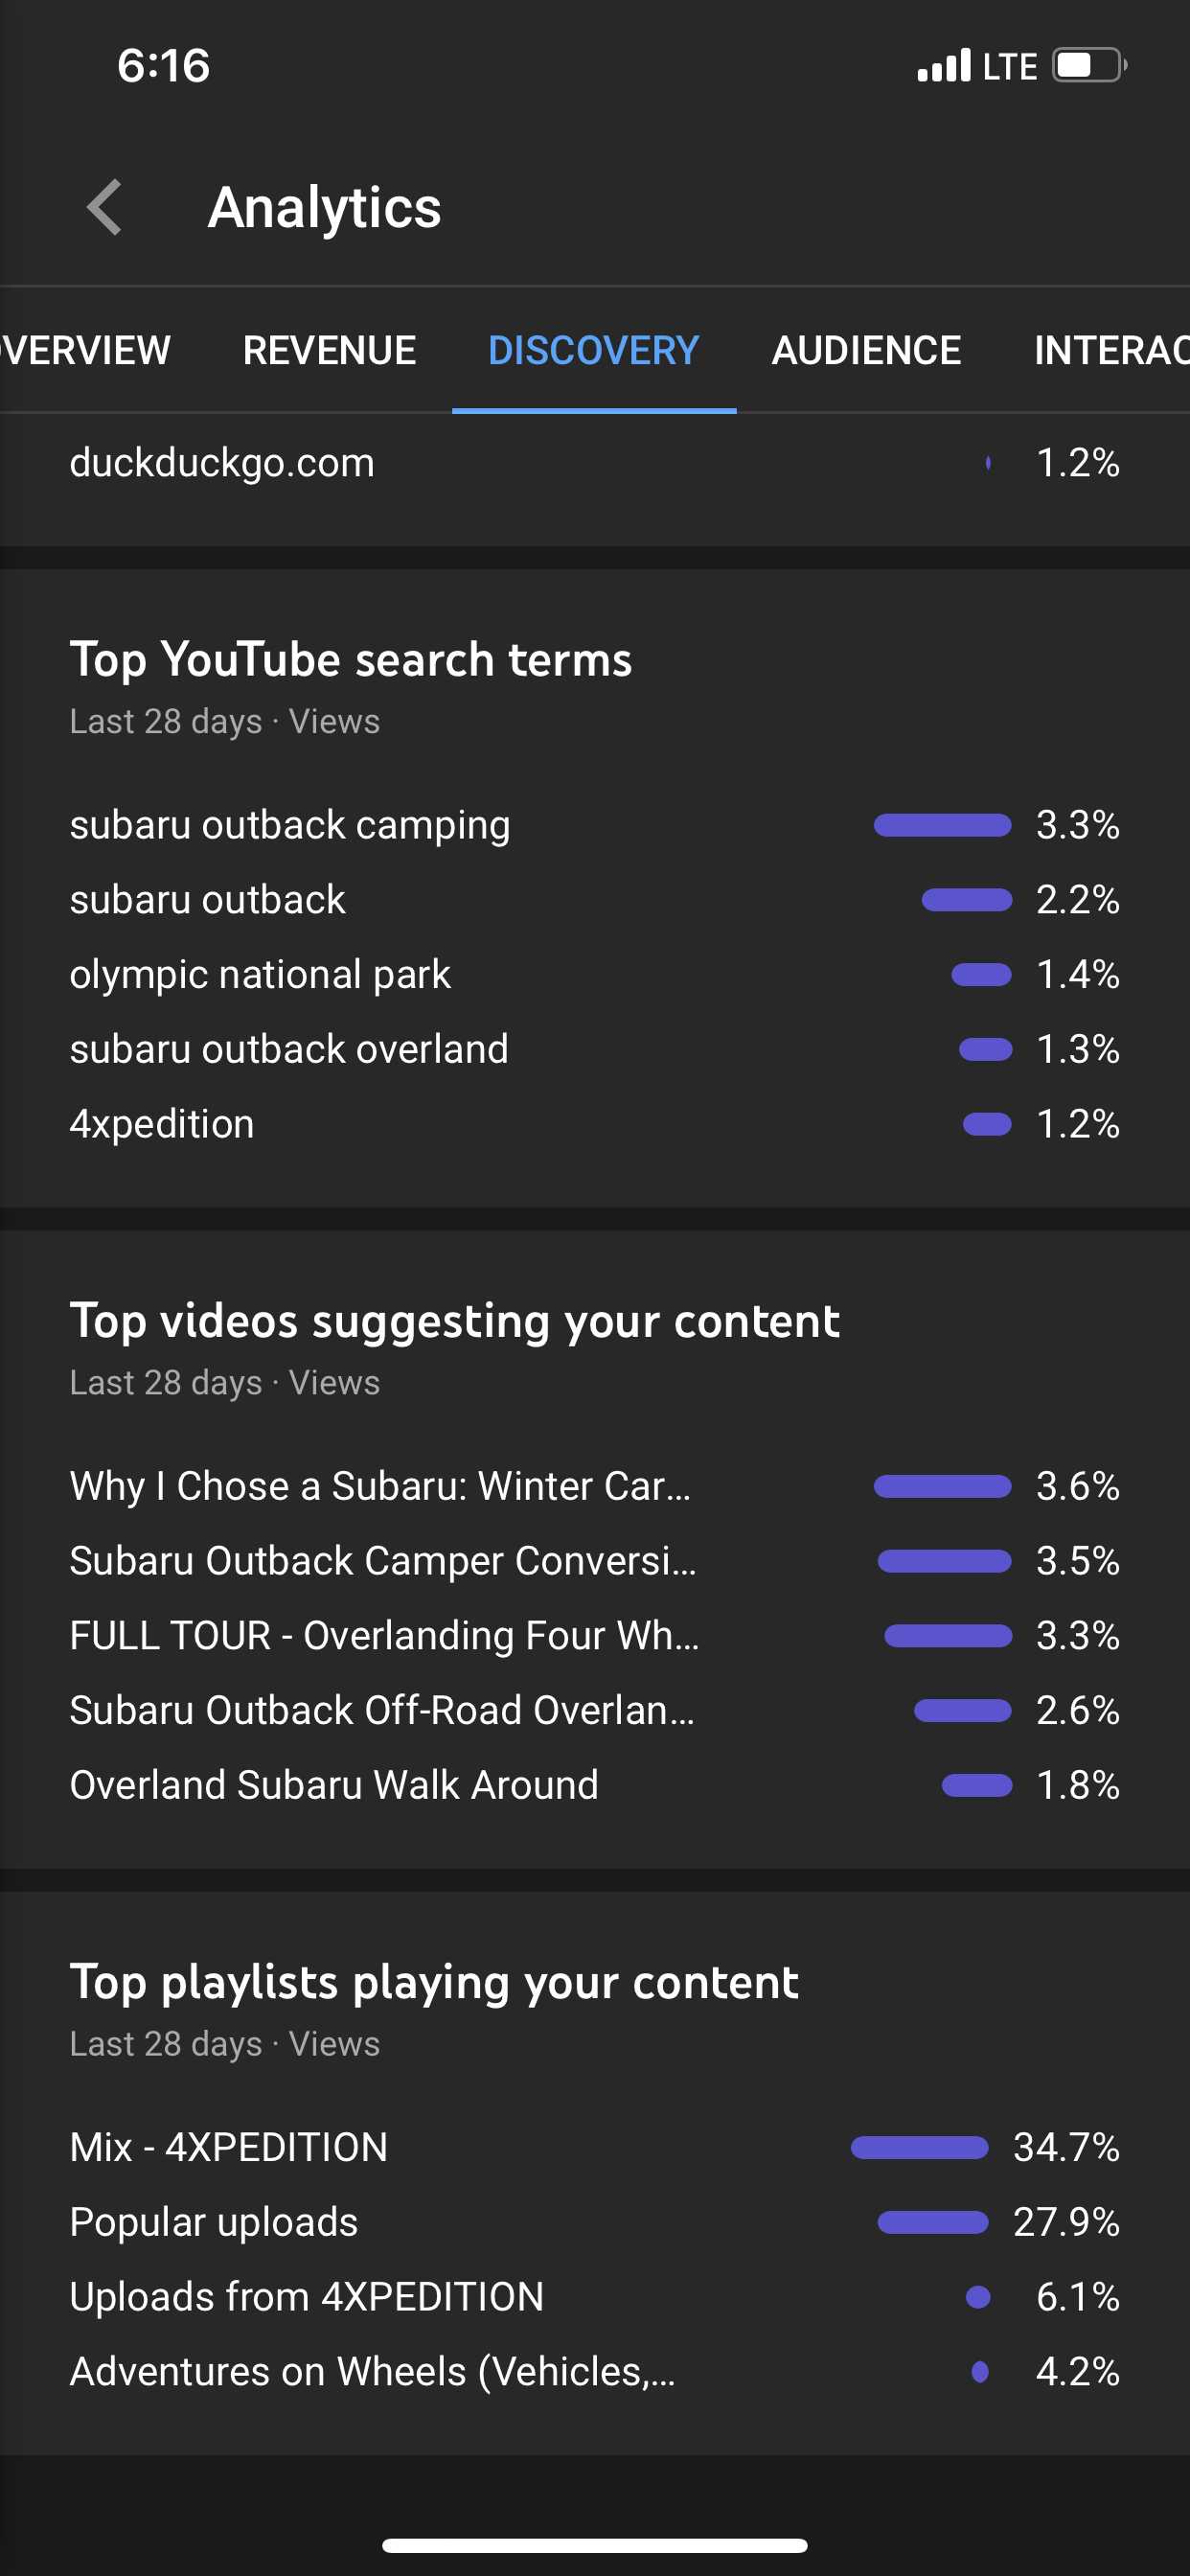
Scrolling further down this screen, you see Top YouTube Search Terms. This view can be expanded to show hundreds of terms people are using to find my channel. As you can see, Subaru is still a very high search term but the expanded view shows many other types. When I share a new video that is of a new subject with different potential search terms, this expands my overall reach into new subject categories and new people that may not have otherwise found me. So, for instance, adding a new video on Bikepacking drives a new type of viewer to my channel and expands the funnel of inbound traffic from a wider range of search terms.
Below that you see other videos that are suggesting my videos. This is the sidebar offerings by YouTube as well as the video that plays following someone else’s video that a viewer just watched.
Below that shows my top playlists on my channel and the top playlists that another account has created that contains one of my videos.
So there you have it in a nutshell. I plan to launch a course on leveraging information online to build a sustainable brand. There is a method to what I am doing. It isn’t random and it isn’t scattered. It takes time, dedication and focus. And, it isn’t always pretty. It can be frustrating at times seeing other channels trend because the channel cover image shows a pretty girl in a bikini for a video talking about a Sprinter build or a fake Photoshoped cover image of a jeep going off a cliff when that isn’t what actually happens in the video. This is called Click bait and I refuse to play that game. My goal is to create real content, a real channel, and a real subscriber base of people that are truly engaged…engaged enough to become members of TEAM 4X.

Shop Our Entire Catalog!
Look cool this spring and show your support of the 4X Initiative. We give back! 5% of all purchase proceeds benefit The Nature Conservancy.
FROM OUR SPONSOR